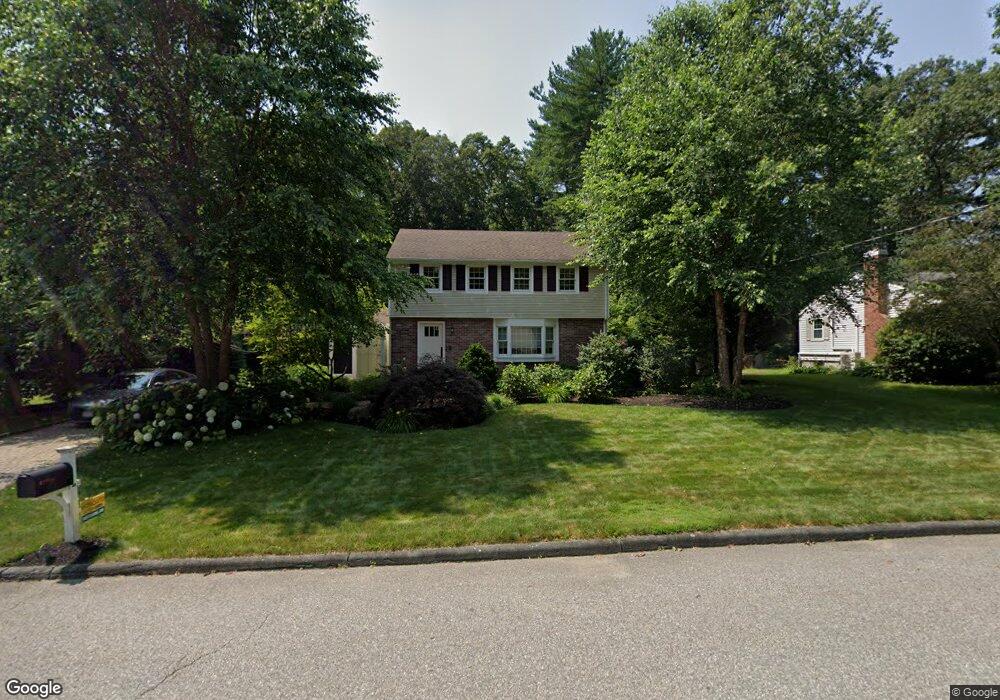
26 Moore St Wilmington, MA 01887
Estimated Value: $691,269 - $753,000
3
Beds
2
Baths
1,372
Sq Ft
$526/Sq Ft
Est. Value
About This Home
This home is located at 26 Moore St, Wilmington, MA 01887 and is currently estimated at $721,817, approximately $526 per square foot. 26 Moore St is a home located in Middlesex County with nearby schools including Wilmington Middle School, Wilmington High School, and Abundant Life Christian School and Childcare.
Ownership History
Date
Name
Owned For
Owner Type
Purchase Details
Closed on
Jun 28, 1996
Sold by
Prybyla James D and Schultz Jane
Bought by
Sullivan Gary
Current Estimated Value
Purchase Details
Closed on
Aug 27, 1992
Sold by
Ranberg Cora M
Bought by
Prybyla James D
Create a Home Valuation Report for This Property
The Home Valuation Report is an in-depth analysis detailing your home's value as well as a comparison with similar homes in the area
Home Values in the Area
Average Home Value in this Area
Purchase History
| Date | Buyer | Sale Price | Title Company |
|---|---|---|---|
| Sullivan Gary | $156,250 | -- | |
| Prybyla James D | $157,500 | -- |
Source: Public Records
Mortgage History
| Date | Status | Borrower | Loan Amount |
|---|---|---|---|
| Closed | Prybyla James D | $184,000 | |
| Closed | Prybyla James D | $191,000 |
Source: Public Records
Tax History Compared to Growth
Tax History
| Year | Tax Paid | Tax Assessment Tax Assessment Total Assessment is a certain percentage of the fair market value that is determined by local assessors to be the total taxable value of land and additions on the property. | Land | Improvement |
|---|---|---|---|---|
| 2025 | $6,868 | $599,800 | $330,700 | $269,100 |
| 2024 | $6,762 | $591,600 | $330,700 | $260,900 |
| 2023 | $6,540 | $547,700 | $300,600 | $247,100 |
| 2022 | $6,110 | $468,900 | $250,400 | $218,500 |
| 2021 | $5,991 | $432,900 | $227,600 | $205,300 |
| 2020 | $5,683 | $418,500 | $227,600 | $190,900 |
| 2019 | $5,467 | $397,600 | $216,900 | $180,700 |
| 2018 | $5,332 | $370,000 | $206,500 | $163,500 |
| 2017 | $5,294 | $366,400 | $206,500 | $159,900 |
| 2016 | $4,990 | $341,100 | $196,700 | $144,400 |
| 2015 | $4,833 | $336,300 | $196,700 | $139,600 |
| 2014 | $4,520 | $317,400 | $187,300 | $130,100 |
Source: Public Records
Map
Nearby Homes