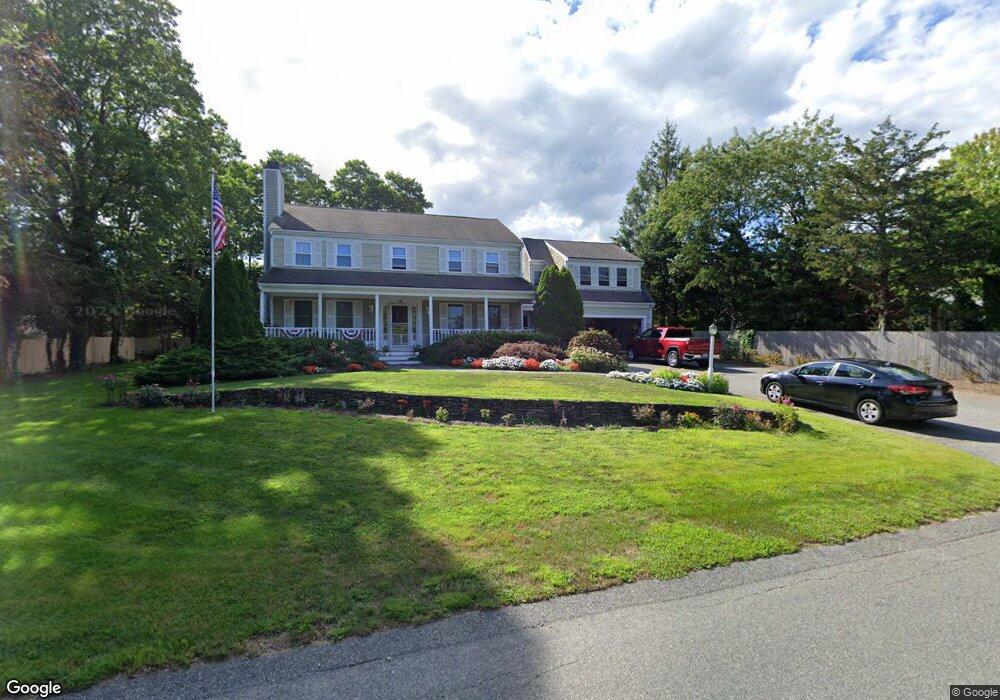
26 Morse Pond Rd Falmouth, MA 02540
Falmouth Village NeighborhoodEstimated Value: $1,262,059 - $1,672,000
4
Beds
3
Baths
3,093
Sq Ft
$477/Sq Ft
Est. Value
About This Home
This home is located at 26 Morse Pond Rd, Falmouth, MA 02540 and is currently estimated at $1,476,015, approximately $477 per square foot. 26 Morse Pond Rd is a home located in Barnstable County with nearby schools including Mullen-Hall School, Lawrence School, and Morse Pond School.
Ownership History
Date
Name
Owned For
Owner Type
Purchase Details
Closed on
Jun 25, 1996
Sold by
Alferes Charles T and Alferes Ethel L
Bought by
Morrison Richard J and Morrison Jean M
Current Estimated Value
Create a Home Valuation Report for This Property
The Home Valuation Report is an in-depth analysis detailing your home's value as well as a comparison with similar homes in the area
Home Values in the Area
Average Home Value in this Area
Purchase History
| Date | Buyer | Sale Price | Title Company |
|---|---|---|---|
| Morrison Richard J | $59,000 | -- | |
| Morrison Richard J | $59,000 | -- |
Source: Public Records
Mortgage History
| Date | Status | Borrower | Loan Amount |
|---|---|---|---|
| Open | Morrison Richard J | $2,739 | |
| Open | Morrison Richard J | $25,000 | |
| Open | Morrison Richard J | $281,150 |
Source: Public Records
Tax History Compared to Growth
Tax History
| Year | Tax Paid | Tax Assessment Tax Assessment Total Assessment is a certain percentage of the fair market value that is determined by local assessors to be the total taxable value of land and additions on the property. | Land | Improvement |
|---|---|---|---|---|
| 2025 | $6,839 | $1,165,000 | $331,800 | $833,200 |
| 2024 | $6,591 | $1,049,600 | $288,800 | $760,800 |
| 2023 | $6,008 | $868,200 | $231,100 | $637,100 |
| 2022 | $6,058 | $752,500 | $216,100 | $536,400 |
| 2021 | $5,806 | $683,100 | $216,100 | $467,000 |
| 2020 | $5,479 | $637,800 | $196,400 | $441,400 |
| 2019 | $5,430 | $634,300 | $196,400 | $437,900 |
| 2018 | $5,265 | $612,200 | $196,400 | $415,800 |
| 2017 | $5,072 | $594,600 | $196,400 | $398,200 |
| 2016 | $4,977 | $594,600 | $196,400 | $398,200 |
| 2015 | $4,870 | $594,600 | $196,400 | $398,200 |
| 2014 | $4,623 | $567,300 | $196,500 | $370,800 |
Source: Public Records
Map
Nearby Homes
- 110 Dillingham Ave Unit 322
- 480 Main St Unit 1
- 22 Alma Rd
- 55 Jericho Path
- 253 Scranton Ave
- 354 Gifford St Unit 5
- 354 Gifford St Unit 2
- 354 Gifford St Unit 6
- 37 Rydal Mount Dr
- 30 Katherine Lee Bates Rd
- 98 Main St
- 98 Main St Unit 1
- 65 Walker St
- 33 Oakwood Ave
- 71 Main St
- 156 Teaticket Hwy
- 29 Miami Ave
- 286 Grand Ave Unit 6
- 28 Morse Pond Rd
- 0 Morse Pond Rd
- 24 Morse Pond Rd
- 14 Lantern Ln
- 16 Lantern Ln
- 19 Morse Pond Rd
- 8 Morse Pond Rd
- 224 Dillingham Ave Unit 224
- 10 Lantern Ln
- 15 Lantern Ln
- 17 Lantern Ln
- 11 Lantern Ln
- 7 Morse Pond Rd
- 3 Morse Pond Rd
- 9 Lantern Ln
- 7 Lantern Ln
- 614 Main St
- 662 Main St
- 6 Lantern Ln
- 5 Lantern Ln