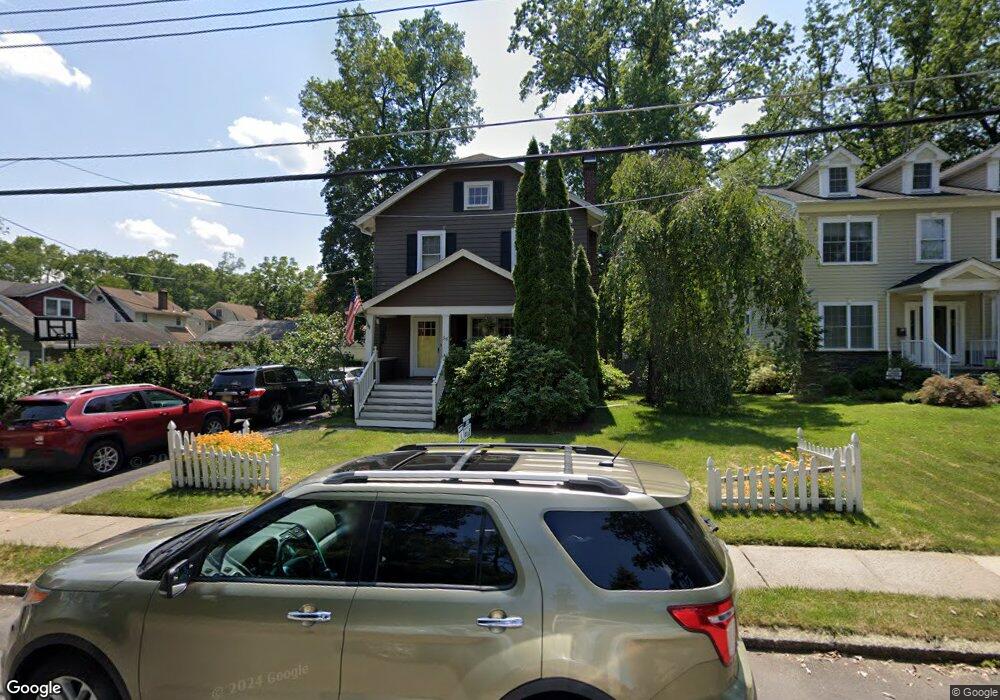
26 Myrtle Ave Chatham, NJ 07928
Estimated Value: $744,000 - $1,073,000
Studio
--
Bath
1,202
Sq Ft
$733/Sq Ft
Est. Value
About This Home
This home is located at 26 Myrtle Ave, Chatham, NJ 07928 and is currently estimated at $881,581, approximately $733 per square foot. 26 Myrtle Ave is a home located in Morris County with nearby schools including Chatham High School, St. Patrick School, and ECLC of New Jersey.
Ownership History
Date
Name
Owned For
Owner Type
Purchase Details
Closed on
Jun 1, 1999
Sold by
Mulcahy William and Mulcahy Rosalinda
Bought by
Mcaloon Timothy J and Mcaloon Sharon K
Current Estimated Value
Home Financials for this Owner
Home Financials are based on the most recent Mortgage that was taken out on this home.
Original Mortgage
$240,000
Outstanding Balance
$62,254
Interest Rate
6.85%
Estimated Equity
$819,327
Purchase Details
Closed on
Apr 22, 1996
Sold by
Dimuzio Anthony A and Miller Gregg
Bought by
Mulcahy William and Mulcahy Rosalinda
Home Financials for this Owner
Home Financials are based on the most recent Mortgage that was taken out on this home.
Original Mortgage
$170,000
Interest Rate
7.67%
Purchase Details
Closed on
May 1, 1995
Sold by
Cox Dorothy S and Cox Nancy
Bought by
Dimuzio Anthony A and Miller Gregg
Create a Home Valuation Report for This Property
The Home Valuation Report is an in-depth analysis detailing your home's value as well as a comparison with similar homes in the area
Home Values in the Area
Average Home Value in this Area
Purchase History
| Date | Buyer | Sale Price | Title Company |
|---|---|---|---|
| Mcaloon Timothy J | $305,000 | -- | |
| Mulcahy William | $235,000 | -- | |
| Dimuzio Anthony A | $155,000 | -- |
Source: Public Records
Mortgage History
| Date | Status | Borrower | Loan Amount |
|---|---|---|---|
| Open | Mcaloon Timothy J | $240,000 | |
| Previous Owner | Mulcahy William | $170,000 |
Source: Public Records
Tax History
| Year | Tax Paid | Tax Assessment Tax Assessment Total Assessment is a certain percentage of the fair market value that is determined by local assessors to be the total taxable value of land and additions on the property. | Land | Improvement |
|---|---|---|---|---|
| 2025 | $9,497 | $586,600 | $412,500 | $174,100 |
| 2024 | $9,116 | $586,600 | $412,500 | $174,100 |
| 2023 | $9,116 | $586,600 | $412,500 | $174,100 |
| 2022 | $10,766 | $503,800 | $384,400 | $119,400 |
| 2021 | $10,766 | $503,800 | $384,400 | $119,400 |
| 2020 | $10,676 | $503,800 | $384,400 | $119,400 |
| 2019 | $10,600 | $503,800 | $384,400 | $119,400 |
| 2018 | $10,303 | $503,800 | $384,400 | $119,400 |
| 2017 | $10,005 | $503,800 | $384,400 | $119,400 |
| 2016 | $9,743 | $503,800 | $384,400 | $119,400 |
| 2015 | $9,628 | $503,800 | $384,400 | $119,400 |
| 2014 | $9,557 | $503,800 | $384,400 | $119,400 |
Source: Public Records
Map
Nearby Homes
- 49 Minton Ave
- 35 Tallmadge Ave
- 20 Summit Ave
- 15 N Hillside Ave
- 26 Pihlman Place
- 47 Canoe Brook Pkwy
- 102 Watchung Ave
- 2 Rose Ln
- 128 Fairmount Ave
- 120 Center Ave
- 195 Hillside Ave
- 55 River Rd
- 16 Meadowbrook Rd
- 38 Inwood Rd
- 181 Center Ave
- 154 Woodland Ave
- 247 Hillside Ave
- 28 Falmouth Rd
- 6 Lorraine Rd
- 50 Canterbury Rd