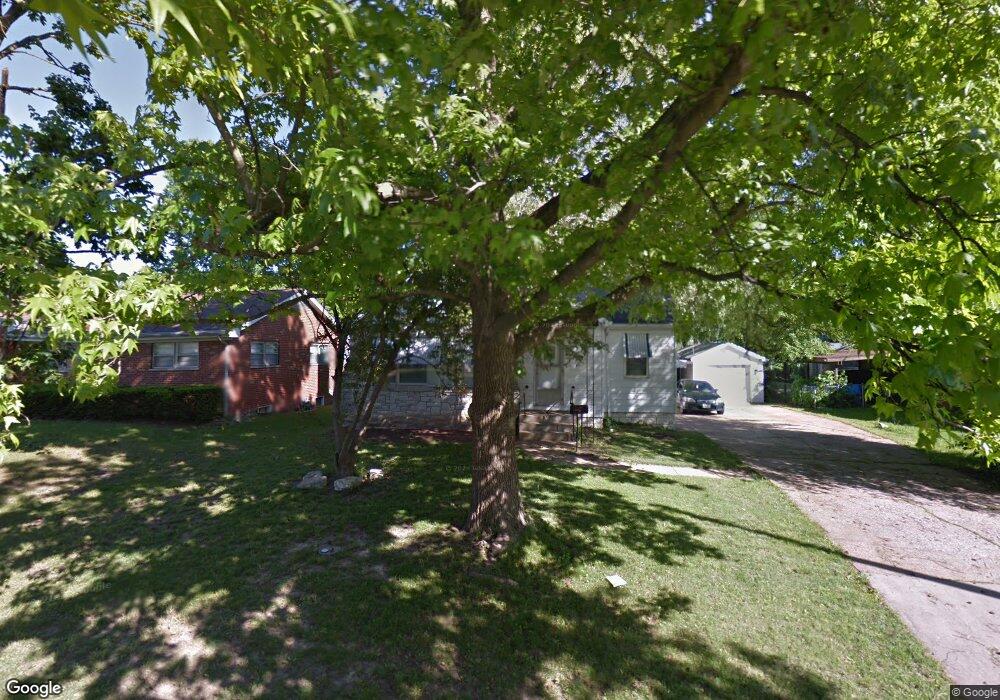
26 N 41st St Belleville, IL 62226
Estimated Value: $76,000 - $119,000
--
Bed
--
Bath
962
Sq Ft
$101/Sq Ft
Est. Value
About This Home
This home is located at 26 N 41st St, Belleville, IL 62226 and is currently estimated at $97,073, approximately $100 per square foot. 26 N 41st St is a home located in St. Clair County with nearby schools including Union Elementary School, West Jr High School, and Our Lady Queen Of Peace Catholic School.
Ownership History
Date
Name
Owned For
Owner Type
Purchase Details
Closed on
Jul 1, 2008
Sold by
Harvey Michael C
Bought by
Blsh Inc
Current Estimated Value
Purchase Details
Closed on
Jan 15, 2004
Sold by
West Point Bank & Trust Co
Bought by
The Land Trust For The Benefit Of Childr
Home Financials for this Owner
Home Financials are based on the most recent Mortgage that was taken out on this home.
Original Mortgage
$50,000
Interest Rate
6.08%
Mortgage Type
Purchase Money Mortgage
Purchase Details
Closed on
Mar 25, 2002
Sold by
Metropolitan Mtg & Securities Co Inc
Bought by
West Pointe Bank & Trust Company and Trust #85-00-0327-31
Home Financials for this Owner
Home Financials are based on the most recent Mortgage that was taken out on this home.
Original Mortgage
$50,000
Interest Rate
6.93%
Mortgage Type
Purchase Money Mortgage
Create a Home Valuation Report for This Property
The Home Valuation Report is an in-depth analysis detailing your home's value as well as a comparison with similar homes in the area
Home Values in the Area
Average Home Value in this Area
Purchase History
| Date | Buyer | Sale Price | Title Company |
|---|---|---|---|
| Blsh Inc | -- | Chicago Title | |
| The Land Trust For The Benefit Of Childr | -- | Benchmark Title Company | |
| West Pointe Bank & Trust Company | $39,000 | Town & Country Title Co |
Source: Public Records
Mortgage History
| Date | Status | Borrower | Loan Amount |
|---|---|---|---|
| Previous Owner | The Land Trust For The Benefit Of Childr | $50,000 | |
| Previous Owner | West Pointe Bank & Trust Company | $50,000 |
Source: Public Records
Tax History Compared to Growth
Tax History
| Year | Tax Paid | Tax Assessment Tax Assessment Total Assessment is a certain percentage of the fair market value that is determined by local assessors to be the total taxable value of land and additions on the property. | Land | Improvement |
|---|---|---|---|---|
| 2024 | $2,620 | $29,790 | $4,715 | $25,075 |
| 2023 | $2,741 | $29,201 | $4,622 | $24,579 |
| 2022 | $2,516 | $26,288 | $4,161 | $22,127 |
| 2021 | $2,423 | $24,303 | $3,847 | $20,456 |
| 2020 | $2,355 | $22,982 | $3,638 | $19,344 |
| 2019 | $2,347 | $22,650 | $3,643 | $19,007 |
| 2018 | $2,294 | $22,160 | $3,564 | $18,596 |
| 2017 | $1,153 | $22,004 | $3,539 | $18,465 |
| 2016 | $2,248 | $21,537 | $3,464 | $18,073 |
| 2014 | $1,078 | $23,317 | $4,172 | $19,145 |
| 2013 | $2,134 | $23,651 | $4,232 | $19,419 |
Source: Public Records
Map
Nearby Homes