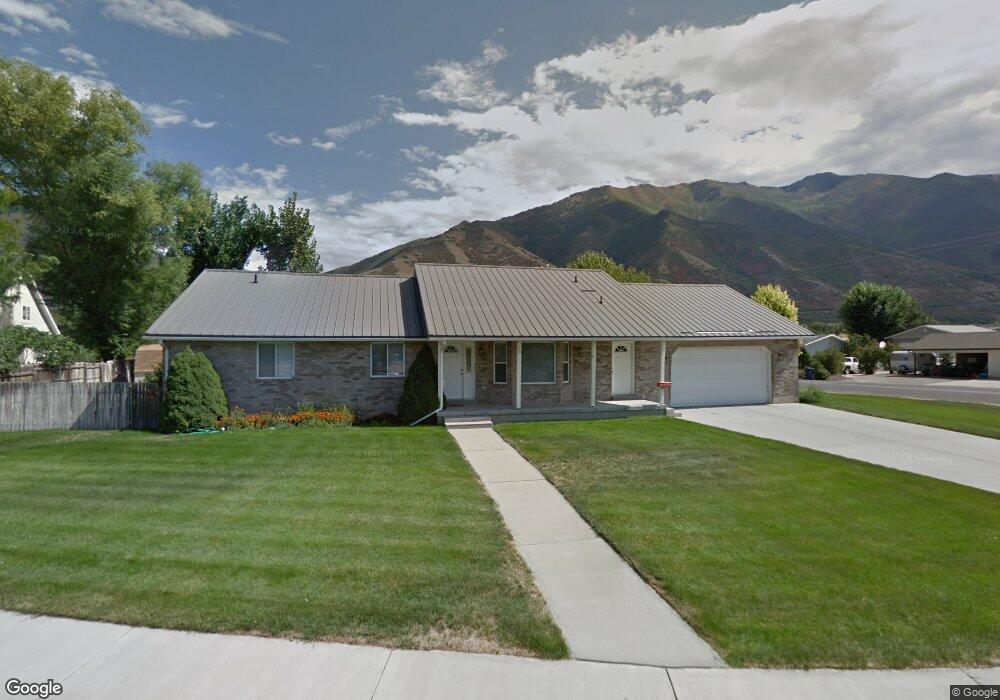
26 N 800 E Mapleton, UT 84664
Estimated Value: $677,765 - $739,000
4
Beds
4
Baths
3,500
Sq Ft
$199/Sq Ft
Est. Value
About This Home
This home is located at 26 N 800 E, Mapleton, UT 84664 and is currently estimated at $695,191, approximately $198 per square foot. 26 N 800 E is a home located in Utah County with nearby schools including Mapleton School, Mapleton Junior High School, and Maple Mountain High School.
Ownership History
Date
Name
Owned For
Owner Type
Purchase Details
Closed on
Oct 24, 2023
Sold by
Best Richard and Best Marci
Bought by
Richard And Marci Best Living Trust and Best
Current Estimated Value
Purchase Details
Closed on
Feb 14, 2020
Sold by
Inuyama Sayuri
Bought by
Beglin Brandon and Beglin Patricia
Home Financials for this Owner
Home Financials are based on the most recent Mortgage that was taken out on this home.
Original Mortgage
$200,500
Interest Rate
3.72%
Mortgage Type
FHA
Purchase Details
Closed on
Feb 18, 2016
Sold by
Shuklas Kathlyn Parry and Kitchen Janice Parry
Bought by
Best Richard and Best Marci
Home Financials for this Owner
Home Financials are based on the most recent Mortgage that was taken out on this home.
Original Mortgage
$279,700
Interest Rate
3.97%
Mortgage Type
New Conventional
Purchase Details
Closed on
Aug 29, 2002
Sold by
Parry William C and Parry Esther H
Bought by
Parry William Conrad and Houtz Esther Rowena
Create a Home Valuation Report for This Property
The Home Valuation Report is an in-depth analysis detailing your home's value as well as a comparison with similar homes in the area
Home Values in the Area
Average Home Value in this Area
Purchase History
| Date | Buyer | Sale Price | Title Company |
|---|---|---|---|
| Richard And Marci Best Living Trust | -- | None Listed On Document | |
| Beglin Brandon | -- | First American Title Ins Co | |
| Best Richard | -- | Access Title Co | |
| Parry William Conrad | -- | -- |
Source: Public Records
Mortgage History
| Date | Status | Borrower | Loan Amount |
|---|---|---|---|
| Previous Owner | Beglin Brandon | $200,500 | |
| Previous Owner | Best Richard | $279,700 |
Source: Public Records
Tax History
| Year | Tax Paid | Tax Assessment Tax Assessment Total Assessment is a certain percentage of the fair market value that is determined by local assessors to be the total taxable value of land and additions on the property. | Land | Improvement |
|---|---|---|---|---|
| 2025 | $3,209 | $342,155 | -- | -- |
| 2024 | $3,316 | $314,325 | $0 | $0 |
| 2023 | $3,316 | $326,920 | $0 | $0 |
| 2022 | $3,288 | $320,540 | $0 | $0 |
| 2021 | $2,744 | $410,600 | $163,300 | $247,300 |
| 2020 | $2,707 | $391,800 | $144,500 | $247,300 |
| 2019 | $2,394 | $353,700 | $138,700 | $215,000 |
| 2018 | $2,196 | $308,900 | $116,800 | $192,100 |
| 2017 | $2,181 | $162,800 | $0 | $0 |
| 2016 | $2,140 | $158,785 | $0 | $0 |
| 2015 | $2,014 | $148,555 | $0 | $0 |
| 2014 | $1,847 | $133,760 | $0 | $0 |
Source: Public Records
Map
Nearby Homes
- 745 E Maple St
- 162 N 800 E
- 1377 E Maple St
- 310 N 800 E
- 141 N 600 E
- 415 E Maple St
- 775 N 800 E
- 1515 E Maple St
- 265 E 600 N
- 4021 S Ironwood Ln Unit 428
- 4886 S Englemann Ln Unit 525
- 2254 715 S Unit 60
- 4013 S Ironwood Ln Unit 432
- 4014 S Ironwood Ln
- 4001 S Ironwood Ln Unit 438
- 2254 715 S
- 4012 S Ironwood Ln Unit 424
- 2042 715 S Unit 57
- 4019 S Ironwood Ln Unit 429
- 2042 715 S
- 825 E Maple St
- 70 N 800 E
- 89 N 800 E
- 89 N 800 E Unit 12
- 810 E Maple St
- 852 E Maple St
- 95 N 800 E
- 927 E Maple St
- 102 N 800 E
- 764 E Maple St
- 912 E Maple St
- 912 E Maple St Unit 12B
- 715 E Maple St
- 135 N 800 E
- 285 E Maple St
- 943 E Maple St
- 132 N 800 E
- 732 E Maple St
- 950 E Maple St
- 950 E Maple St Unit 13A
Your Personal Tour Guide
Ask me questions while you tour the home.