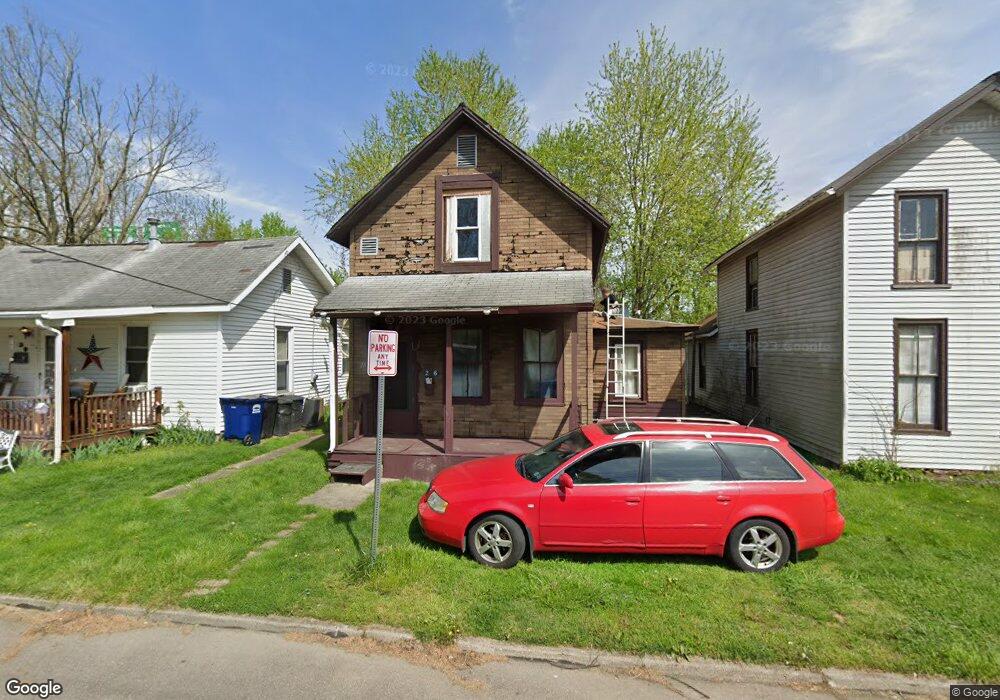
26 N Arch St Newark, OH 43055
Estimated Value: $75,000 - $157,000
2
Beds
2
Baths
977
Sq Ft
$122/Sq Ft
Est. Value
About This Home
This home is located at 26 N Arch St, Newark, OH 43055 and is currently estimated at $118,894, approximately $121 per square foot. 26 N Arch St is a home located in Licking County with nearby schools including Ben Franklin Elementary School, Heritage Middle School, and Newark High School.
Ownership History
Date
Name
Owned For
Owner Type
Purchase Details
Closed on
Jul 19, 2024
Sold by
True Real Estate Solutions Llc and D Harris Investments Llc
Bought by
Johnson Trace J
Current Estimated Value
Purchase Details
Closed on
May 22, 2023
Sold by
Hupp Mark C and Hupp Kathy
Bought by
True Real Estate Solutions Llc
Home Financials for this Owner
Home Financials are based on the most recent Mortgage that was taken out on this home.
Original Mortgage
$40,000
Interest Rate
5.76%
Mortgage Type
Construction
Purchase Details
Closed on
Feb 1, 1996
Sold by
M & K Enterprises
Bought by
East Mound Community Dev Corp
Create a Home Valuation Report for This Property
The Home Valuation Report is an in-depth analysis detailing your home's value as well as a comparison with similar homes in the area
Home Values in the Area
Average Home Value in this Area
Purchase History
| Date | Buyer | Sale Price | Title Company |
|---|---|---|---|
| Johnson Trace J | $16,000 | None Listed On Document | |
| True Real Estate Solutions Llc | $27,000 | None Listed On Document | |
| East Mound Community Dev Corp | $15,000 | -- |
Source: Public Records
Mortgage History
| Date | Status | Borrower | Loan Amount |
|---|---|---|---|
| Previous Owner | True Real Estate Solutions Llc | $40,000 |
Source: Public Records
Tax History Compared to Growth
Tax History
| Year | Tax Paid | Tax Assessment Tax Assessment Total Assessment is a certain percentage of the fair market value that is determined by local assessors to be the total taxable value of land and additions on the property. | Land | Improvement |
|---|---|---|---|---|
| 2024 | $887 | $24,190 | $4,900 | $19,290 |
| 2023 | $944 | $24,510 | $5,220 | $19,290 |
| 2022 | $639 | $15,580 | $3,120 | $12,460 |
| 2021 | $670 | $15,580 | $3,120 | $12,460 |
| 2020 | $692 | $15,580 | $3,120 | $12,460 |
| 2019 | $580 | $12,570 | $2,590 | $9,980 |
| 2018 | $581 | $0 | $0 | $0 |
| 2017 | $587 | $0 | $0 | $0 |
| 2016 | $604 | $0 | $0 | $0 |
| 2015 | $617 | $0 | $0 | $0 |
| 2014 | $769 | $0 | $0 | $0 |
| 2013 | $589 | $0 | $0 | $0 |
Source: Public Records
Map
Nearby Homes