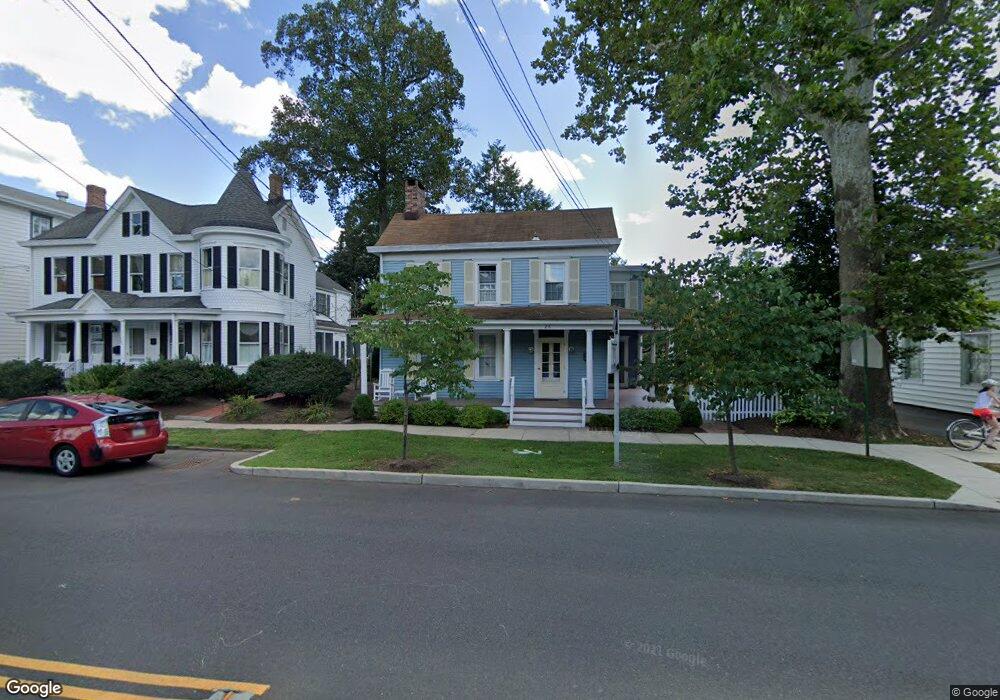
26 N Main St Cranbury, NJ 08512
Estimated Value: $1,441,000 - $1,611,000
--
Bed
5
Baths
5,649
Sq Ft
$267/Sq Ft
Est. Value
About This Home
This home is located at 26 N Main St, Cranbury, NJ 08512 and is currently estimated at $1,510,781, approximately $267 per square foot. 26 N Main St is a home located in Middlesex County with nearby schools including The Cranbury School, SciCore Academy, and E Windsor Knowledge Beginnings.
Ownership History
Date
Name
Owned For
Owner Type
Purchase Details
Closed on
Sep 1, 2011
Sold by
Petrucelli Steven P and Petrucelli Karen S
Bought by
Kim Stephen J and Kim Julie C
Current Estimated Value
Home Financials for this Owner
Home Financials are based on the most recent Mortgage that was taken out on this home.
Original Mortgage
$580,000
Outstanding Balance
$396,565
Interest Rate
4.38%
Mortgage Type
Commercial
Estimated Equity
$1,114,216
Create a Home Valuation Report for This Property
The Home Valuation Report is an in-depth analysis detailing your home's value as well as a comparison with similar homes in the area
Home Values in the Area
Average Home Value in this Area
Purchase History
| Date | Buyer | Sale Price | Title Company |
|---|---|---|---|
| Kim Stephen J | $725,000 | Chicago Title Insurance Co |
Source: Public Records
Mortgage History
| Date | Status | Borrower | Loan Amount |
|---|---|---|---|
| Open | Kim Stephen J | $580,000 |
Source: Public Records
Tax History Compared to Growth
Tax History
| Year | Tax Paid | Tax Assessment Tax Assessment Total Assessment is a certain percentage of the fair market value that is determined by local assessors to be the total taxable value of land and additions on the property. | Land | Improvement |
|---|---|---|---|---|
| 2025 | $12,983 | $707,900 | $252,300 | $455,600 |
| 2024 | $12,799 | $707,900 | $252,300 | $455,600 |
| 2023 | $12,799 | $707,900 | $252,300 | $455,600 |
| 2022 | $12,615 | $707,900 | $252,300 | $455,600 |
| 2021 | $9,482 | $707,900 | $252,300 | $455,600 |
| 2020 | $12,601 | $707,900 | $252,300 | $455,600 |
| 2019 | $12,735 | $707,900 | $252,300 | $455,600 |
| 2018 | $13,939 | $707,900 | $252,300 | $455,600 |
| 2017 | $13,570 | $707,900 | $252,300 | $455,600 |
| 2016 | $13,684 | $707,900 | $252,300 | $455,600 |
| 2015 | $13,436 | $707,900 | $252,300 | $455,600 |
| 2014 | $13,486 | $707,900 | $252,300 | $455,600 |
Source: Public Records
Map
Nearby Homes