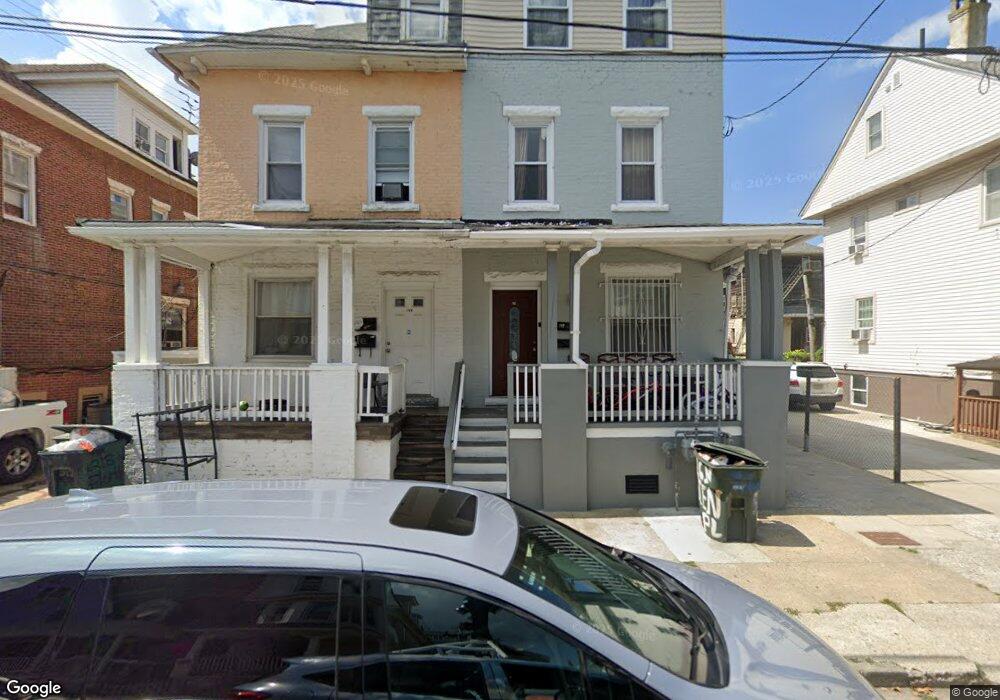
26 N Stenton Place Atlantic City, NJ 08401
Chelsea NeighborhoodEstimated Value: $234,053 - $363,000
--
Bed
--
Bath
1,744
Sq Ft
$169/Sq Ft
Est. Value
About This Home
This home is located at 26 N Stenton Place, Atlantic City, NJ 08401 and is currently estimated at $294,351, approximately $168 per square foot. 26 N Stenton Place is a home located in Atlantic County with nearby schools including Brighton Avenue School, Atlantic City High School, and Our Lady Star of the Sea Regional School.
Ownership History
Date
Name
Owned For
Owner Type
Purchase Details
Closed on
May 16, 2003
Sold by
Hud
Bought by
Uddin Jashim
Current Estimated Value
Home Financials for this Owner
Home Financials are based on the most recent Mortgage that was taken out on this home.
Original Mortgage
$97,850
Outstanding Balance
$42,466
Interest Rate
5.77%
Mortgage Type
Purchase Money Mortgage
Estimated Equity
$251,885
Purchase Details
Closed on
Nov 26, 2002
Sold by
M & T Mort Corp
Bought by
Hud
Purchase Details
Closed on
Dec 23, 1999
Sold by
Sukoff Albert R and Sukoff Eugene
Bought by
Vianna Andre and Rodriguez Monica
Home Financials for this Owner
Home Financials are based on the most recent Mortgage that was taken out on this home.
Original Mortgage
$88,830
Interest Rate
7.73%
Mortgage Type
FHA
Purchase Details
Closed on
Oct 22, 1997
Sold by
Casino Reinvestment Development Authorit
Bought by
Adamar Of New Jersey Inc
Create a Home Valuation Report for This Property
The Home Valuation Report is an in-depth analysis detailing your home's value as well as a comparison with similar homes in the area
Home Values in the Area
Average Home Value in this Area
Purchase History
| Date | Buyer | Sale Price | Title Company |
|---|---|---|---|
| Uddin Jashim | $103,000 | -- | |
| Uddin Jashim | $103,000 | Independence Abstract & Titl | |
| Hud | -- | -- | |
| Vianna Andre | $65,000 | Fidelity National Title Ins | |
| Adamar Of New Jersey Inc | $227,960 | -- |
Source: Public Records
Mortgage History
| Date | Status | Borrower | Loan Amount |
|---|---|---|---|
| Open | Uddin Jashim | $97,850 | |
| Closed | Uddin Jashim | $97,850 | |
| Previous Owner | Vianna Andre | $88,830 |
Source: Public Records
Tax History Compared to Growth
Tax History
| Year | Tax Paid | Tax Assessment Tax Assessment Total Assessment is a certain percentage of the fair market value that is determined by local assessors to be the total taxable value of land and additions on the property. | Land | Improvement |
|---|---|---|---|---|
| 2025 | $3,521 | $102,000 | $30,400 | $71,600 |
| 2024 | $3,521 | $102,000 | $30,400 | $71,600 |
| 2023 | $3,853 | $102,000 | $30,400 | $71,600 |
| 2022 | $3,853 | $102,000 | $30,400 | $71,600 |
| 2021 | $3,979 | $102,000 | $30,400 | $71,600 |
| 2020 | $4,013 | $102,000 | $30,400 | $71,600 |
| 2019 | $2,988 | $75,000 | $37,500 | $37,500 |
| 2018 | $2,650 | $75,000 | $37,500 | $37,500 |
| 2017 | $2,566 | $75,000 | $37,500 | $37,500 |
| 2016 | $2,895 | $75,000 | $37,500 | $37,500 |
| 2015 | $2,567 | $75,000 | $30,000 | $45,000 |
| 2014 | $3,013 | $90,000 | $40,000 | $50,000 |
Source: Public Records
Map
Nearby Homes
- 23 N Iowa Ave
- 27 N Iowa Ave
- 2801 Arctic Ave
- 2834 Atlantic 1202a Ave Unit 1202
- 2834 Atlantic Ave Unit 1010
- 2834 Atlantic Ave Unit 509
- 2834 Atlantic Ave Unit 104
- 2834 Atlantic Ave Unit 401
- 2834 Atlantic Ave Unit 310
- 2834 Atlantic Ave Unit PENTHOUSE 4
- 2834 Atlantic Ave Unit 915
- 2834 Atlantic Ave Unit PH4
- 2834 Atlantic Ave Unit 702
- 2834 Atlantic Ave Unit 512
- 2834 Atlantic Ave Unit 1202
- 2834 Atlantic Ave Unit 507
- 2834 Atlantic Ave Unit 1209
- 2925 Atlantic Ave
- 113 N Brighton Ave
- 33 S Iowa Ave Unit A1
- 24 N Stenton Place
- 28 N Stenton Place
- 22 N Stenton Place
- 20 N Stenton Place
- 21 N Brighton Ave
- 30 N Stenton Place
- 18 N Stenton Place
- 23 1/2 N Stenton Place
- 23 N Stenton Place Unit A
- 23 N Stenton Place Unit B
- 23 N Stenton Place
- 29 N Stenton Place
- 9 N Brighton Ave
- 21 N Stenton Place
- 38 N Stenton Place
- 23 N Brighton Ave
- 23 N Brighton Ave
- 7 N Brighton Ave
- 19 N Stenton Place
- 12 N Stenton Place