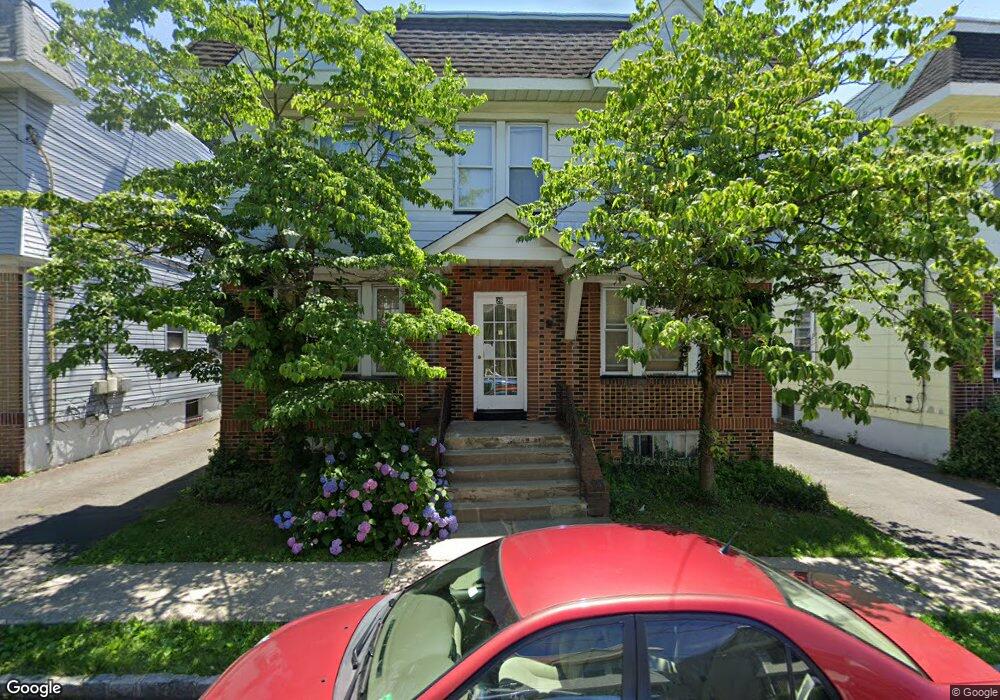
26 Nelson Place Maplewood, NJ 07040
Estimated Value: $865,000 - $975,000
--
Bed
--
Bath
3,672
Sq Ft
$250/Sq Ft
Est. Value
About This Home
This home is located at 26 Nelson Place, Maplewood, NJ 07040 and is currently estimated at $916,244, approximately $249 per square foot. 26 Nelson Place is a home located in Essex County with nearby schools including Seth Boyden Elementary School, Maplewood Middle School, and Columbia Senior High School.
Ownership History
Date
Name
Owned For
Owner Type
Purchase Details
Closed on
Jan 22, 2021
Sold by
63 S Cooks Bridge Llc
Bought by
Feldberger Yitzchok
Current Estimated Value
Home Financials for this Owner
Home Financials are based on the most recent Mortgage that was taken out on this home.
Original Mortgage
$405,000
Outstanding Balance
$361,400
Interest Rate
2.7%
Mortgage Type
New Conventional
Estimated Equity
$554,844
Purchase Details
Closed on
Sep 14, 2020
Sold by
Jagernauth Ivan A and Jagernauth Phyllis A
Bought by
63 S Cooks Bridge Llc
Home Financials for this Owner
Home Financials are based on the most recent Mortgage that was taken out on this home.
Original Mortgage
$490,000
Interest Rate
1.2%
Mortgage Type
New Conventional
Purchase Details
Closed on
Aug 18, 1992
Sold by
Francois Serge and Francois Francois
Bought by
Jagernauth Ivan and Jagernauth Phyllis
Purchase Details
Closed on
Jan 3, 1989
Sold by
Charles Eddy and Charles Deslourdes
Bought by
Francois Serge and Francois Charles,Eddy
Create a Home Valuation Report for This Property
The Home Valuation Report is an in-depth analysis detailing your home's value as well as a comparison with similar homes in the area
Home Values in the Area
Average Home Value in this Area
Purchase History
| Date | Buyer | Sale Price | Title Company |
|---|---|---|---|
| Feldberger Yitzchok | -- | Universal Title | |
| 63 S Cooks Bridge Llc | $490,000 | Universal Title | |
| Jagernauth Ivan | $200,000 | -- | |
| Jagernauth Ivan A | $200,000 | -- | |
| Francois Serge | -- | -- |
Source: Public Records
Mortgage History
| Date | Status | Borrower | Loan Amount |
|---|---|---|---|
| Open | Feldberger Yitzchok | $405,000 | |
| Previous Owner | 63 S Cooks Bridge Llc | $490,000 |
Source: Public Records
Tax History Compared to Growth
Tax History
| Year | Tax Paid | Tax Assessment Tax Assessment Total Assessment is a certain percentage of the fair market value that is determined by local assessors to be the total taxable value of land and additions on the property. | Land | Improvement |
|---|---|---|---|---|
| 2025 | $12,143 | $644,500 | $210,800 | $433,700 |
| 2024 | $12,143 | $644,500 | $210,800 | $433,700 |
| 2022 | $11,840 | $335,800 | $113,000 | $222,800 |
| 2021 | $11,481 | $335,800 | $113,000 | $222,800 |
| 2020 | $11,155 | $335,800 | $113,000 | $222,800 |
| 2019 | $10,833 | $335,800 | $113,000 | $222,800 |
| 2018 | $10,554 | $335,800 | $113,000 | $222,800 |
| 2017 | $10,239 | $335,800 | $113,000 | $222,800 |
| 2016 | $12,161 | $330,000 | $91,800 | $238,200 |
| 2015 | $11,880 | $330,000 | $91,800 | $238,200 |
| 2014 | $11,629 | $330,000 | $91,800 | $238,200 |
Source: Public Records
Map
Nearby Homes
- 30 Nelson Place
- 25 Evelyn Ct
- 168 Jacoby St
- 173 Jacoby St
- 79 Coolidge St
- 37 Menzel Ave
- 51 Hughes St
- 28 Beechwood Place
- 179 Hollywood Ave
- 30 Harding Terrace
- 1018 Stuyvesant Ave Unit C0056
- 1018 Stuyvesant Ave Unit 2
- 2043-2045 Ostwood Terrace
- 29 Schaefer Rd
- 36 Olympic Terrace
- 34 Olympic Terrace
- 1 44th St Unit 1
- 74 Burnett Ave
- 74 Burnett Ave Unit 2
- 64 Hardgrove Terrace
- 22 Nelson Place
- 30 Nelson Place Unit 1L
- 18 Nelson Place
- 15 Troy Ct
- 15 Troy Ct Unit 2
- 17 Troy Ct
- 17 Troy Ct Unit 2
- 14 Nelson Place
- 14 Nelson Place Unit 1
- 14 Nelson Plaza Unit 1L
- 14 Nelson Plaza Unit 2R
- 14 Nelson Plaza
- 25 Nelson Place Unit 4
- 25 Nelson Place
- 25 Nelson Place Unit 1L
- 19 Troy Ct
- 29 Nelson Place
- 21 Nelson Place
- 21 Nelson Place Unit 4
- 21 Nelson Place Unit 2L