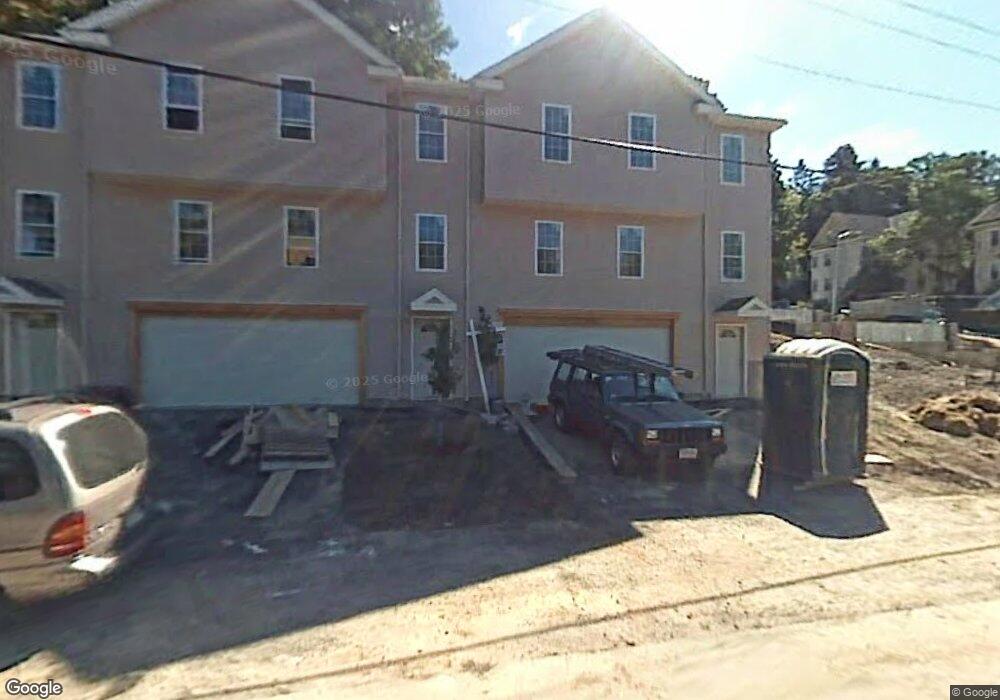
26 New St Worcester, MA 01605
Brittan Square NeighborhoodEstimated Value: $408,910 - $448,000
3
Beds
2
Baths
1,344
Sq Ft
$315/Sq Ft
Est. Value
About This Home
This home is located at 26 New St, Worcester, MA 01605 and is currently estimated at $422,978, approximately $314 per square foot. 26 New St is a home located in Worcester County with nearby schools including Jacob Hiatt Magnet School, Chandler Magnet, and Wawecus Road School.
Ownership History
Date
Name
Owned For
Owner Type
Purchase Details
Closed on
Dec 18, 2007
Sold by
Gold Star Builders Inc
Bought by
Frimpongmaah Yaa Nana
Current Estimated Value
Home Financials for this Owner
Home Financials are based on the most recent Mortgage that was taken out on this home.
Original Mortgage
$143,040
Outstanding Balance
$90,538
Interest Rate
6.3%
Mortgage Type
Purchase Money Mortgage
Estimated Equity
$332,440
Create a Home Valuation Report for This Property
The Home Valuation Report is an in-depth analysis detailing your home's value as well as a comparison with similar homes in the area
Home Values in the Area
Average Home Value in this Area
Purchase History
| Date | Buyer | Sale Price | Title Company |
|---|---|---|---|
| Frimpongmaah Yaa Nana | $178,800 | -- | |
| Frimpongmaah Yaa Nana | $178,800 | -- |
Source: Public Records
Mortgage History
| Date | Status | Borrower | Loan Amount |
|---|---|---|---|
| Open | Frimpongmaah Yaa Nana | $143,040 | |
| Closed | Frimpongmaah Yaa Nana | $143,040 |
Source: Public Records
Tax History
| Year | Tax Paid | Tax Assessment Tax Assessment Total Assessment is a certain percentage of the fair market value that is determined by local assessors to be the total taxable value of land and additions on the property. | Land | Improvement |
|---|---|---|---|---|
| 2025 | $4,663 | $353,500 | $83,400 | $270,100 |
| 2024 | $4,488 | $326,400 | $83,400 | $243,000 |
| 2023 | $4,301 | $299,900 | $72,500 | $227,400 |
| 2022 | $3,909 | $257,000 | $58,000 | $199,000 |
| 2021 | $3,764 | $231,200 | $46,400 | $184,800 |
| 2020 | $3,691 | $217,100 | $46,100 | $171,000 |
| 2019 | $3,528 | $196,000 | $40,200 | $155,800 |
| 2018 | $3,523 | $186,300 | $40,200 | $146,100 |
| 2017 | $3,325 | $173,000 | $40,200 | $132,800 |
| 2016 | $3,279 | $159,100 | $29,200 | $129,900 |
| 2015 | $3,193 | $159,100 | $29,200 | $129,900 |
| 2014 | $3,109 | $159,100 | $29,200 | $129,900 |
Source: Public Records
Map
Nearby Homes
- 27 Harlow St
- 249 Lincoln St
- 33 Denmark St
- 176 Lincoln St Unit 4
- 32 Hemans St
- 74 Green Hill Pkwy
- 78 Green Hill Pkwy
- 20B Edgeworth St
- 26 Orne St
- 3 Perkins St
- 63 North St Unit D
- 63 North St Unit C
- 63 North St Unit B
- 63 North St Unit A
- 5 Wakefield St
- 6 Ashburnham Rd
- 30 Melrose St
- 10 Dryden St Unit 7
- 139 Lincoln St
- 2 Selden St
Your Personal Tour Guide
Ask me questions while you tour the home.