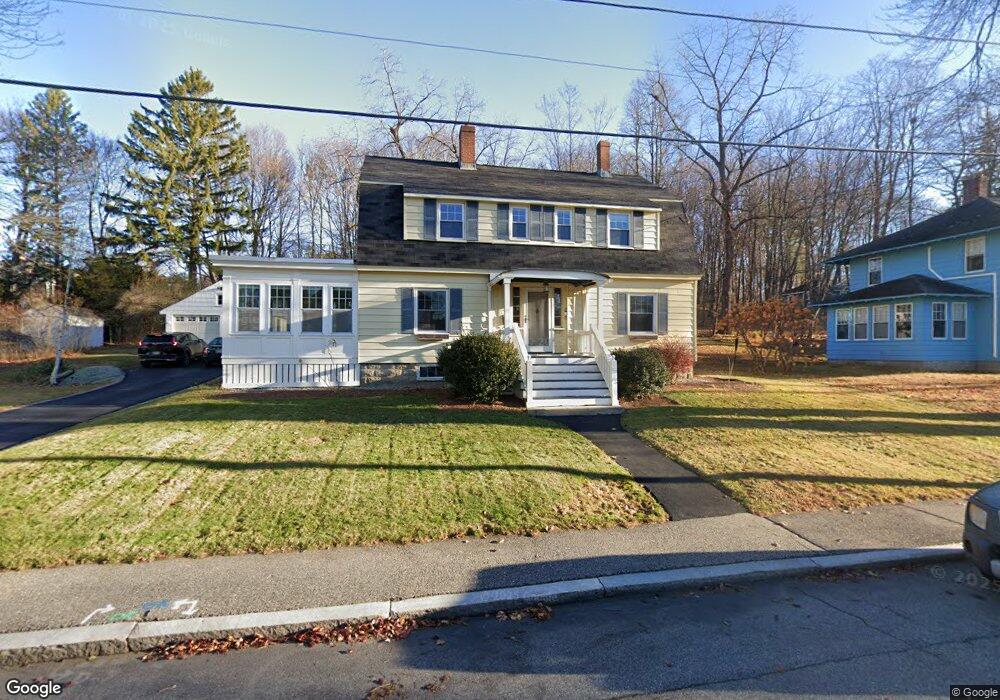
26 Orchard St Biddeford, ME 04005
Estimated Value: $527,000 - $568,000
4
Beds
2
Baths
2,082
Sq Ft
$262/Sq Ft
Est. Value
About This Home
This home is located at 26 Orchard St, Biddeford, ME 04005 and is currently estimated at $546,335, approximately $262 per square foot. 26 Orchard St is a home located in York County with nearby schools including John F Kennedy Memorial School, Biddeford Primary School, and Biddeford Intermediate School.
Ownership History
Date
Name
Owned For
Owner Type
Purchase Details
Closed on
Apr 27, 2010
Sold by
Jacques Kevin N and Jacques Aline J
Bought by
Fogg Benjamin C and Fogg Jill S
Current Estimated Value
Home Financials for this Owner
Home Financials are based on the most recent Mortgage that was taken out on this home.
Original Mortgage
$228,288
Outstanding Balance
$156,345
Interest Rate
5.5%
Mortgage Type
FHA
Estimated Equity
$389,990
Create a Home Valuation Report for This Property
The Home Valuation Report is an in-depth analysis detailing your home's value as well as a comparison with similar homes in the area
Home Values in the Area
Average Home Value in this Area
Purchase History
| Date | Buyer | Sale Price | Title Company |
|---|---|---|---|
| Fogg Benjamin C | -- | -- |
Source: Public Records
Mortgage History
| Date | Status | Borrower | Loan Amount |
|---|---|---|---|
| Open | Fogg Benjamin C | $228,288 | |
| Previous Owner | Fogg Benjamin C | $224,900 |
Source: Public Records
Tax History Compared to Growth
Tax History
| Year | Tax Paid | Tax Assessment Tax Assessment Total Assessment is a certain percentage of the fair market value that is determined by local assessors to be the total taxable value of land and additions on the property. | Land | Improvement |
|---|---|---|---|---|
| 2024 | $5,817 | $409,100 | $155,300 | $253,800 |
| 2023 | $5,332 | $406,400 | $152,600 | $253,800 |
| 2022 | $5,002 | $304,800 | $85,800 | $219,000 |
| 2021 | $4,222 | $256,600 | $72,600 | $184,000 |
| 2020 | $4,698 | $234,300 | $66,000 | $168,300 |
| 2019 | $4,681 | $234,300 | $66,000 | $168,300 |
| 2018 | $4,616 | $234,300 | $66,000 | $168,300 |
| 2017 | $4,586 | $228,500 | $66,000 | $162,500 |
| 2016 | $4,538 | $228,500 | $66,000 | $162,500 |
| 2015 | $4,449 | $228,500 | $66,000 | $162,500 |
| 2014 | $4,339 | $228,500 | $66,000 | $162,500 |
| 2013 | -- | $236,800 | $59,200 | $177,600 |
Source: Public Records
Map
Nearby Homes