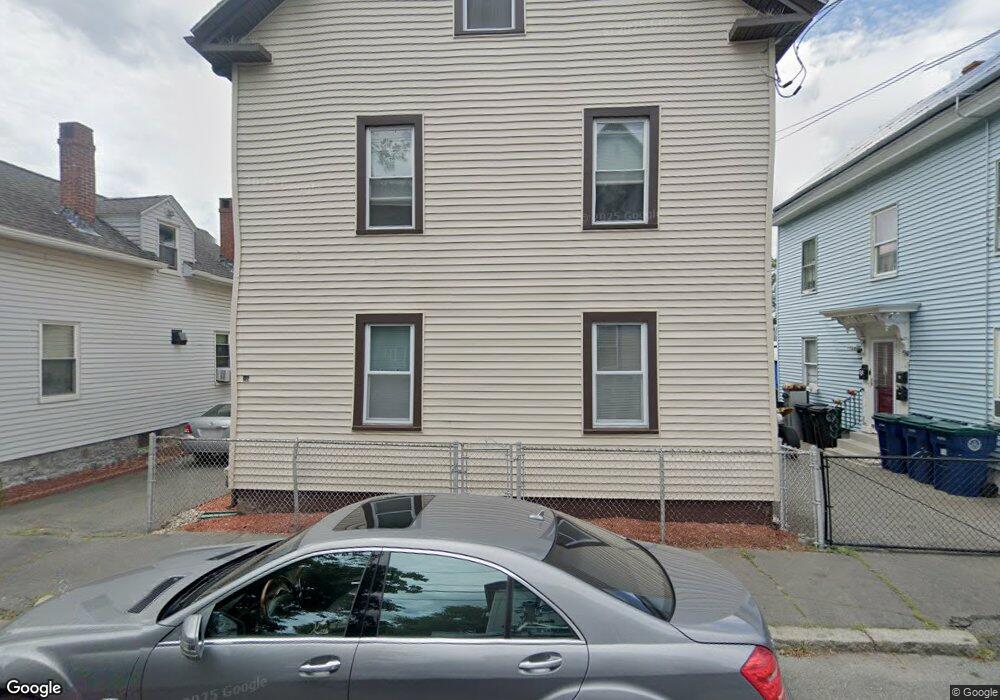
26 Osgood St Unit 2 Salem, MA 01970
Bridge Street NeighborhoodEstimated Value: $574,000 - $774,605
2
Beds
1
Bath
920
Sq Ft
$733/Sq Ft
Est. Value
About This Home
This home is located at 26 Osgood St Unit 2, Salem, MA 01970 and is currently estimated at $674,401, approximately $733 per square foot. 26 Osgood St Unit 2 is a home located in Essex County with nearby schools including Carlton Elementary School, Saltonstall School, and Bates Elementary School.
Ownership History
Date
Name
Owned For
Owner Type
Purchase Details
Closed on
Nov 24, 2021
Sold by
Call Linda J
Bought by
Linda J Call Ft
Current Estimated Value
Purchase Details
Closed on
Dec 1, 2009
Sold by
Call Helen E
Bought by
Call Linda Joan
Purchase Details
Closed on
Aug 12, 2009
Sold by
Call Brian R and Call Helen E
Bought by
Call Helen E
Home Financials for this Owner
Home Financials are based on the most recent Mortgage that was taken out on this home.
Original Mortgage
$201,500
Interest Rate
5.36%
Mortgage Type
Purchase Money Mortgage
Purchase Details
Closed on
Nov 4, 1993
Sold by
Backman John L and Backman Prudence
Bought by
Call Brian R and Dailey Dennis
Create a Home Valuation Report for This Property
The Home Valuation Report is an in-depth analysis detailing your home's value as well as a comparison with similar homes in the area
Home Values in the Area
Average Home Value in this Area
Purchase History
| Date | Buyer | Sale Price | Title Company |
|---|---|---|---|
| Linda J Call Ft | -- | None Available | |
| Call Linda Joan | -- | -- | |
| Call Helen E | -- | -- | |
| Call Brian R | $121,500 | -- |
Source: Public Records
Mortgage History
| Date | Status | Borrower | Loan Amount |
|---|---|---|---|
| Previous Owner | Call Brian R | $201,500 | |
| Previous Owner | Call Brian R | $200,000 | |
| Previous Owner | Call Brian R | $170,000 |
Source: Public Records
Tax History Compared to Growth
Tax History
| Year | Tax Paid | Tax Assessment Tax Assessment Total Assessment is a certain percentage of the fair market value that is determined by local assessors to be the total taxable value of land and additions on the property. | Land | Improvement |
|---|---|---|---|---|
| 2025 | $6,252 | $551,300 | $164,500 | $386,800 |
| 2024 | $5,977 | $514,400 | $155,900 | $358,500 |
| 2023 | $5,791 | $462,900 | $144,300 | $318,600 |
| 2022 | $5,925 | $447,200 | $135,700 | $311,500 |
| 2021 | $5,749 | $416,600 | $135,700 | $280,900 |
| 2020 | $5,455 | $377,500 | $117,200 | $260,300 |
| 2019 | $5,403 | $357,800 | $111,400 | $246,400 |
| 2018 | $4,997 | $324,900 | $106,200 | $218,700 |
| 2017 | $4,622 | $291,400 | $86,600 | $204,800 |
| 2016 | $4,494 | $286,800 | $82,000 | $204,800 |
| 2015 | $4,336 | $264,200 | $73,900 | $190,300 |
Source: Public Records
Map
Nearby Homes
- 14 Lathrop St
- 12 Thorndike St
- 103 Bridge St Unit 2
- 10 Andrew St Unit 2A
- 21 Emerton St Unit 2
- 156 Bridge St Unit B
- 26 Winter St
- 16 Williams St
- 8 Williams St Unit 2
- 40 Essex St Unit 2
- 5 Larchmont Rd Unit 3
- 41 Dearborn St
- 67 Essex St Unit 2
- 67 Essex St Unit 1
- 69 Essex St Unit 2
- 18 Franklin St Unit 402
- 18 Franklin St Unit 303
- 117 Water St Unit 28
- 7 Curtis St Unit 1
- 43 Front St