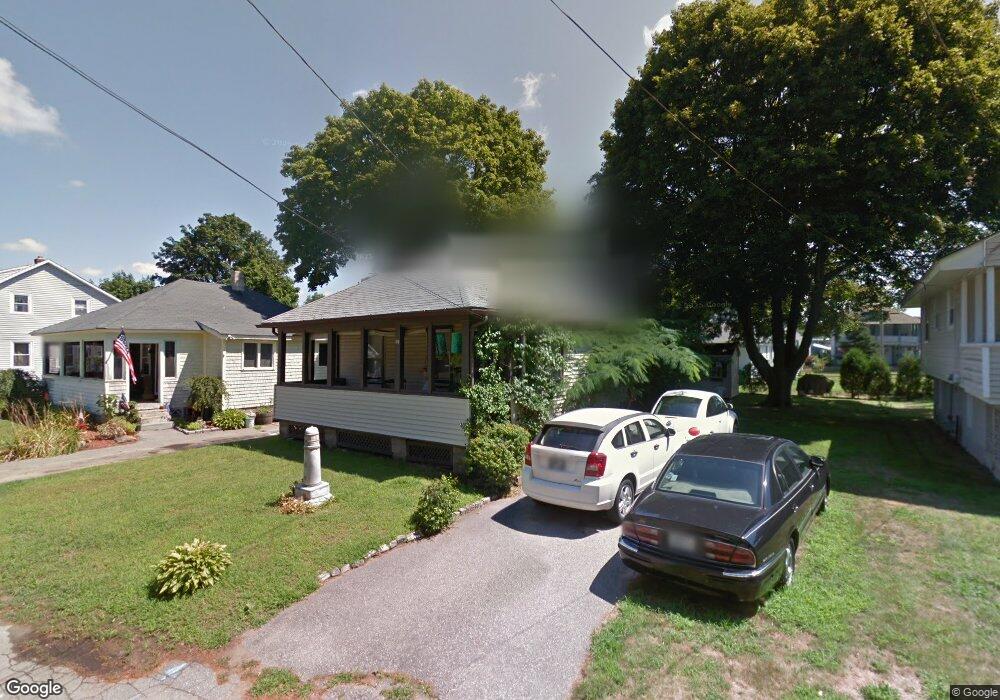
26 Owens St Warwick, RI 02889
Oakland Beach NeighborhoodEstimated Value: $274,000 - $303,116
2
Beds
1
Bath
672
Sq Ft
$430/Sq Ft
Est. Value
About This Home
This home is located at 26 Owens St, Warwick, RI 02889 and is currently estimated at $289,279, approximately $430 per square foot. 26 Owens St is a home located in Kent County with nearby schools including Saint Kevin School and Bishop Hendricken High School.
Ownership History
Date
Name
Owned For
Owner Type
Purchase Details
Closed on
Oct 6, 2000
Sold by
Eaton Rita H Est and White
Bought by
Gammons Mari Anne
Current Estimated Value
Home Financials for this Owner
Home Financials are based on the most recent Mortgage that was taken out on this home.
Original Mortgage
$54,400
Outstanding Balance
$19,363
Interest Rate
7.96%
Mortgage Type
Purchase Money Mortgage
Estimated Equity
$269,916
Purchase Details
Closed on
May 9, 1995
Sold by
Mcleod H Marie
Bought by
Eaton Rita H
Home Financials for this Owner
Home Financials are based on the most recent Mortgage that was taken out on this home.
Original Mortgage
$50,000
Interest Rate
8.36%
Mortgage Type
Purchase Money Mortgage
Create a Home Valuation Report for This Property
The Home Valuation Report is an in-depth analysis detailing your home's value as well as a comparison with similar homes in the area
Home Values in the Area
Average Home Value in this Area
Purchase History
| Date | Buyer | Sale Price | Title Company |
|---|---|---|---|
| Gammons Mari Anne | $68,000 | -- | |
| Eaton Rita H | $50,000 | -- |
Source: Public Records
Mortgage History
| Date | Status | Borrower | Loan Amount |
|---|---|---|---|
| Open | Eaton Rita H | $54,400 | |
| Previous Owner | Eaton Rita H | $50,000 |
Source: Public Records
Tax History
| Year | Tax Paid | Tax Assessment Tax Assessment Total Assessment is a certain percentage of the fair market value that is determined by local assessors to be the total taxable value of land and additions on the property. | Land | Improvement |
|---|---|---|---|---|
| 2025 | $3,330 | $262,200 | $109,000 | $153,200 |
| 2024 | $2,809 | $194,100 | $91,300 | $102,800 |
| 2023 | $2,754 | $194,100 | $91,300 | $102,800 |
| 2022 | $2,088 | $111,500 | $53,600 | $57,900 |
| 2021 | $2,088 | $111,500 | $53,600 | $57,900 |
| 2020 | $2,088 | $111,500 | $53,600 | $57,900 |
| 2019 | $2,088 | $111,500 | $53,600 | $57,900 |
| 2018 | $2,001 | $96,200 | $51,600 | $44,600 |
| 2017 | $1,947 | $96,200 | $51,600 | $44,600 |
| 2016 | $1,947 | $96,200 | $51,600 | $44,600 |
| 2015 | $2,349 | $113,200 | $59,600 | $53,600 |
| 2014 | $2,271 | $113,200 | $59,600 | $53,600 |
| 2013 | $2,240 | $113,200 | $59,600 | $53,600 |
Source: Public Records
Map
Nearby Homes
- 90 Huron St
- 79 Suburban Pkwy
- 444 Pequot Ave
- 357 Pequot Ave
- 52 Hazard Ave
- 107 Coburn St
- 21 Hampton Ave
- 0 Sea View Dr
- 188 Wood St
- 75 Northup St
- 585 Meadow View Ave
- 73 Pinehurst Ave
- 71 Pinehurst Ave
- 31 Oakhurst Ave
- 79 Pinehurst Ave
- 81 Pinehurst Ave
- 170 Medford St
- 357 Warwick Neck Ave
- 0 Meadow View Ave
- 43 Beaver Ave
Your Personal Tour Guide
Ask me questions while you tour the home.