26 Pershing Ave Acushnet, MA 02743
Upper Acushnet NeighborhoodEstimated Value: $495,000 - $568,000
3
Beds
2
Baths
2,085
Sq Ft
$253/Sq Ft
Est. Value
About This Home
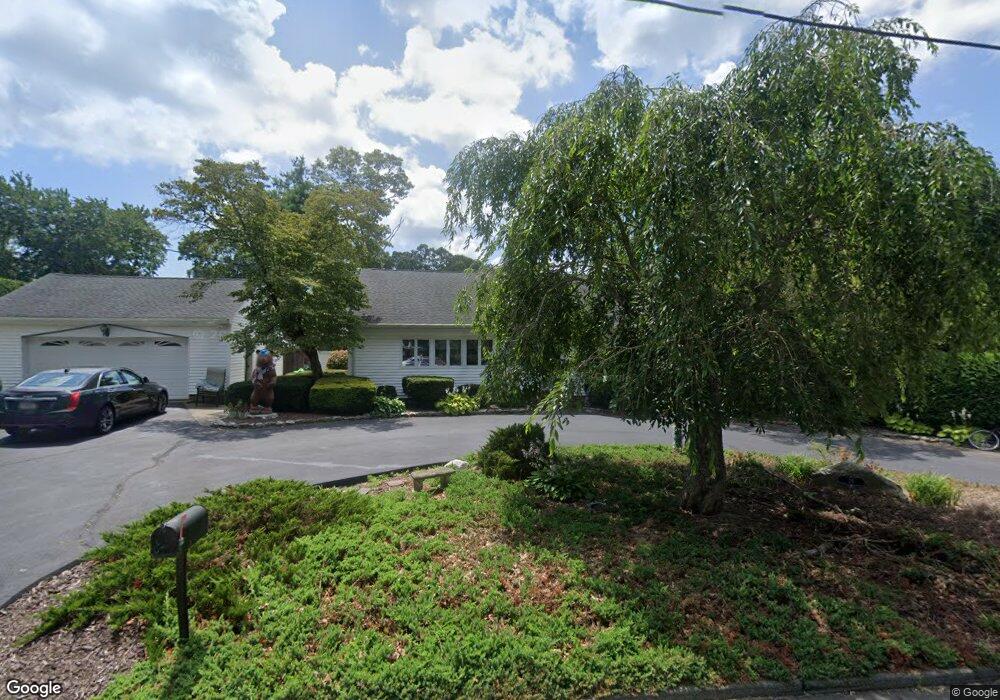
This home is located at 26 Pershing Ave, Acushnet, MA 02743 and is currently estimated at $528,385, approximately $253 per square foot. 26 Pershing Ave is a home located in Bristol County with nearby schools including Acushnet Elementary School, Albert F Ford Middle School, and St Francis Xavier Elementary School.
Ownership History
Date
Name
Owned For
Owner Type
Purchase Details
Closed on
Jun 25, 1999
Sold by
Mello Theresa M
Bought by
Levalley William A and Levalley Carol A
Current Estimated Value
Home Financials for this Owner
Home Financials are based on the most recent Mortgage that was taken out on this home.
Original Mortgage
$100,000
Interest Rate
7.09%
Mortgage Type
Purchase Money Mortgage
Create a Home Valuation Report for This Property
The Home Valuation Report is an in-depth analysis detailing your home's value as well as a comparison with similar homes in the area
Home Values in the Area
Average Home Value in this Area
Purchase History
| Date | Buyer | Sale Price | Title Company |
|---|---|---|---|
| Levalley William A | $155,000 | -- |
Source: Public Records
Mortgage History
| Date | Status | Borrower | Loan Amount |
|---|---|---|---|
| Open | Levalley William A | $130,000 | |
| Closed | Levalley William A | $132,000 | |
| Closed | Levalley William A | $105,000 | |
| Closed | Levalley William A | $100,000 |
Source: Public Records
Tax History Compared to Growth
Tax History
| Year | Tax Paid | Tax Assessment Tax Assessment Total Assessment is a certain percentage of the fair market value that is determined by local assessors to be the total taxable value of land and additions on the property. | Land | Improvement |
|---|---|---|---|---|
| 2025 | $48 | $440,400 | $138,100 | $302,300 |
| 2024 | $4,547 | $398,500 | $130,800 | $267,700 |
| 2023 | $4,424 | $368,700 | $118,700 | $250,000 |
| 2022 | $4,391 | $330,900 | $111,400 | $219,500 |
| 2021 | $4,235 | $306,200 | $111,400 | $194,800 |
| 2020 | $4,168 | $299,000 | $104,200 | $194,800 |
| 2019 | $4,017 | $283,300 | $99,300 | $184,000 |
| 2018 | $3,883 | $269,300 | $99,300 | $170,000 |
| 2017 | $3,773 | $261,300 | $99,300 | $162,000 |
| 2016 | $3,686 | $253,700 | $99,300 | $154,400 |
| 2015 | $3,499 | $245,000 | $99,300 | $145,700 |
Source: Public Records
Map
Nearby Homes
- 11 Chershire Ave
- 29 Pershing Ave
- 20 Pershing Ave
- 34 Pershing Ave
- 23 Pershing Ave
- 33 Pershing Ave
- 12 Chershire Ave
- 21 Pershing Ave
- 16 Pershing Ave
- 40 Pershing Ave
- 262 Hamlin St
- 268 Hamlin St
- 270 Hamlin St
- 258 Hamlin St
- 31 Rogerson Ave
- 272 Hamlin St
- 33 Rogerson Ave
- 25 Chershire Ave
- 11 Rogerson Ave
- 23 Rogerson Ave