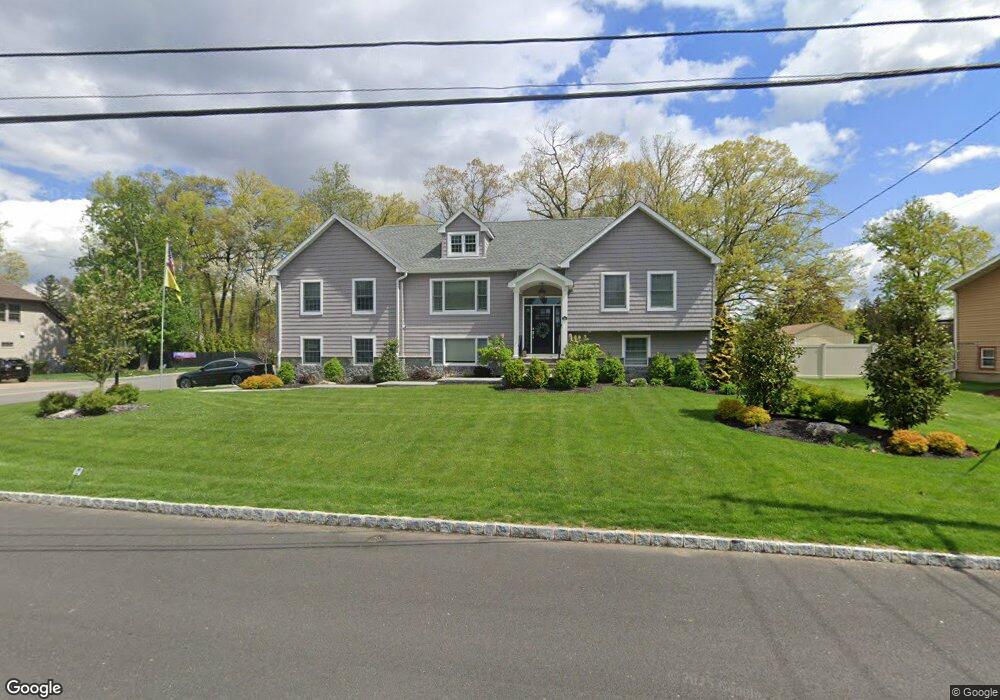
26 Philip Dr Fairfield, NJ 07004
Estimated Value: $1,034,000 - $1,348,000
--
Bed
--
Bath
3,744
Sq Ft
$306/Sq Ft
Est. Value
About This Home
This home is located at 26 Philip Dr, Fairfield, NJ 07004 and is currently estimated at $1,144,078, approximately $305 per square foot. 26 Philip Dr is a home located in Essex County with nearby schools including Adlai E Stevenson School, Churchill, and West Essex Middle School.
Ownership History
Date
Name
Owned For
Owner Type
Purchase Details
Closed on
Oct 1, 2020
Sold by
Moussab Nicholas Anthony and Amoroso Tiziana
Bought by
Moussab Nicholas Anthony and Moussab Lauren
Current Estimated Value
Purchase Details
Closed on
Jan 19, 2011
Sold by
Moussab Nicholas and Moussab Antoinette
Bought by
Moussab Nicholas
Create a Home Valuation Report for This Property
The Home Valuation Report is an in-depth analysis detailing your home's value as well as a comparison with similar homes in the area
Home Values in the Area
Average Home Value in this Area
Purchase History
| Date | Buyer | Sale Price | Title Company |
|---|---|---|---|
| Moussab Nicholas Anthony | $475,000 | Fidelity National Title | |
| Moussab Nicholas | $251,500 | -- |
Source: Public Records
Tax History Compared to Growth
Tax History
| Year | Tax Paid | Tax Assessment Tax Assessment Total Assessment is a certain percentage of the fair market value that is determined by local assessors to be the total taxable value of land and additions on the property. | Land | Improvement |
|---|---|---|---|---|
| 2025 | $15,291 | $744,800 | $301,500 | $443,300 |
| 2024 | $15,291 | $744,800 | $301,500 | $443,300 |
| 2022 | $14,918 | $744,800 | $301,500 | $443,300 |
| 2021 | $10,305 | $508,400 | $301,500 | $206,900 |
| 2020 | $9,827 | $508,400 | $301,500 | $206,900 |
| 2019 | $8,724 | $384,500 | $216,300 | $168,200 |
| 2018 | $8,405 | $384,500 | $216,300 | $168,200 |
| 2017 | $8,428 | $384,500 | $216,300 | $168,200 |
| 2016 | $8,471 | $384,500 | $216,300 | $168,200 |
| 2015 | $7,763 | $384,500 | $216,300 | $168,200 |
| 2014 | $7,521 | $384,500 | $216,300 | $168,200 |
Source: Public Records
Map
Nearby Homes
- 46 John St
- 584-588 U S 46
- 5 Addison Dr
- 131 Horseneck Rd
- 12 Crestwood Ave
- 87 Glenroy Rd E
- 55 Fairfield Rd
- 53 Fairfield Rd
- 128 Big Piece Rd
- 26 Phyllis Ln
- 8 Winfield Ct
- 14 Winfield Ct
- 246 Horseneck Rd
- 29 Plymouth St
- 14 Big Piece Rd
- 18 Cleary Place
- 140 W Greenbrook Rd
- 96 Pier Ln
- 797 Passaic Ave
- 81 Schindler Way