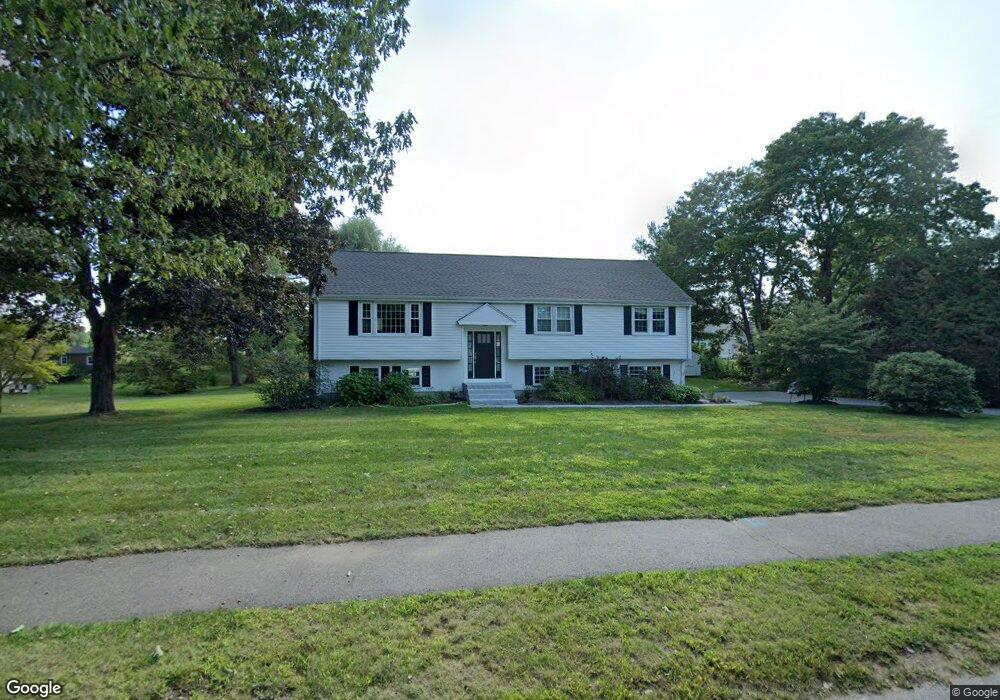
26 Philip Farm Rd Concord, MA 01742
Estimated Value: $1,072,000 - $1,308,000
4
Beds
2
Baths
1,506
Sq Ft
$784/Sq Ft
Est. Value
About This Home
This home is located at 26 Philip Farm Rd, Concord, MA 01742 and is currently estimated at $1,180,641, approximately $783 per square foot. 26 Philip Farm Rd is a home located in Middlesex County with nearby schools including Alcott Elementary School, Concord Middle School, and The Fenn School.
Ownership History
Date
Name
Owned For
Owner Type
Purchase Details
Closed on
Jul 20, 2020
Sold by
Beck Susan C
Bought by
Beck Christopher and Beck Michelle
Current Estimated Value
Purchase Details
Closed on
Jun 15, 2012
Sold by
Pressley Steve and Holloman-Pressley Lynn M
Bought by
Beck Susan C and Beck Christopher
Purchase Details
Closed on
Dec 19, 1991
Sold by
Choi Hong Kyun and Choi Sung M
Bought by
Pressley Steve and Pressley Lynn H
Home Financials for this Owner
Home Financials are based on the most recent Mortgage that was taken out on this home.
Original Mortgage
$218,000
Interest Rate
8.68%
Mortgage Type
Purchase Money Mortgage
Create a Home Valuation Report for This Property
The Home Valuation Report is an in-depth analysis detailing your home's value as well as a comparison with similar homes in the area
Home Values in the Area
Average Home Value in this Area
Purchase History
| Date | Buyer | Sale Price | Title Company |
|---|---|---|---|
| Beck Christopher | -- | None Available | |
| Beck Susan C | $600,000 | -- | |
| Pressley Steve | $272,500 | -- |
Source: Public Records
Mortgage History
| Date | Status | Borrower | Loan Amount |
|---|---|---|---|
| Previous Owner | Pressley Steve | $69,000 | |
| Previous Owner | Pressley Steve | $25,000 | |
| Previous Owner | Pressley Steve | $218,000 | |
| Previous Owner | Pressley Steve | $130,000 |
Source: Public Records
Tax History Compared to Growth
Tax History
| Year | Tax Paid | Tax Assessment Tax Assessment Total Assessment is a certain percentage of the fair market value that is determined by local assessors to be the total taxable value of land and additions on the property. | Land | Improvement |
|---|---|---|---|---|
| 2025 | $136 | $1,027,300 | $595,300 | $432,000 |
| 2024 | $12,501 | $952,100 | $555,700 | $396,400 |
| 2023 | $11,682 | $901,400 | $529,200 | $372,200 |
| 2022 | $10,028 | $679,400 | $384,800 | $294,600 |
| 2021 | $9,955 | $676,300 | $384,800 | $291,500 |
| 2020 | $8,697 | $611,200 | $336,700 | $274,500 |
| 2019 | $8,798 | $620,000 | $345,500 | $274,500 |
| 2018 | $8,738 | $611,500 | $346,800 | $264,700 |
| 2017 | $8,234 | $585,200 | $330,300 | $254,900 |
| 2016 | $7,785 | $559,300 | $296,400 | $262,900 |
| 2015 | $7,942 | $555,800 | $313,700 | $242,100 |
Source: Public Records
Map
Nearby Homes
- 16 Hatch Farm Ln
- 10 Hatch Farm Ln
- 28 Hatch Farm Ln
- 58 Peter Spring Rd
- 644 Old Bedford Rd
- 86 Butternut Cir
- 96 Independence Rd
- 6 Parker Rd
- 140 Revolutionary Rd
- 646 Cambridge Turnpike
- 35 Chestnut St
- 38-40 Court Ln
- 16 Old Cambridge Turnpike
- 5 South Commons Unit D
- 5 Clark Rd
- 61B Walden St
- 36 Indian Camp Ln Unit D
- 9 Garland Rd
- 143 Everett St
- 29 S Commons Unit D
- 38 Philip Farm Rd
- 10 Philip Farm Rd
- 25 Philip Farm Rd
- 48 Philip Farm Rd
- 11 Kenney Ln
- 250 Old Bedford Rd
- 44 Virginia Rd
- 20 Virginia Rd
- 60 Philip Farm Rd
- 31 Virginia Rd
- 282 Old Bedford Rd
- 282 Old Bedford Rd
- 23 Kenney Ln
- 12 Kenney Ln
- 70 Philip Farm Rd
- 49 Virginia Rd
- 16 Meriam Rd
- 66 Virginia Rd
- 22 Kenney Ln
- 277 Old Bedford Rd Unit 277