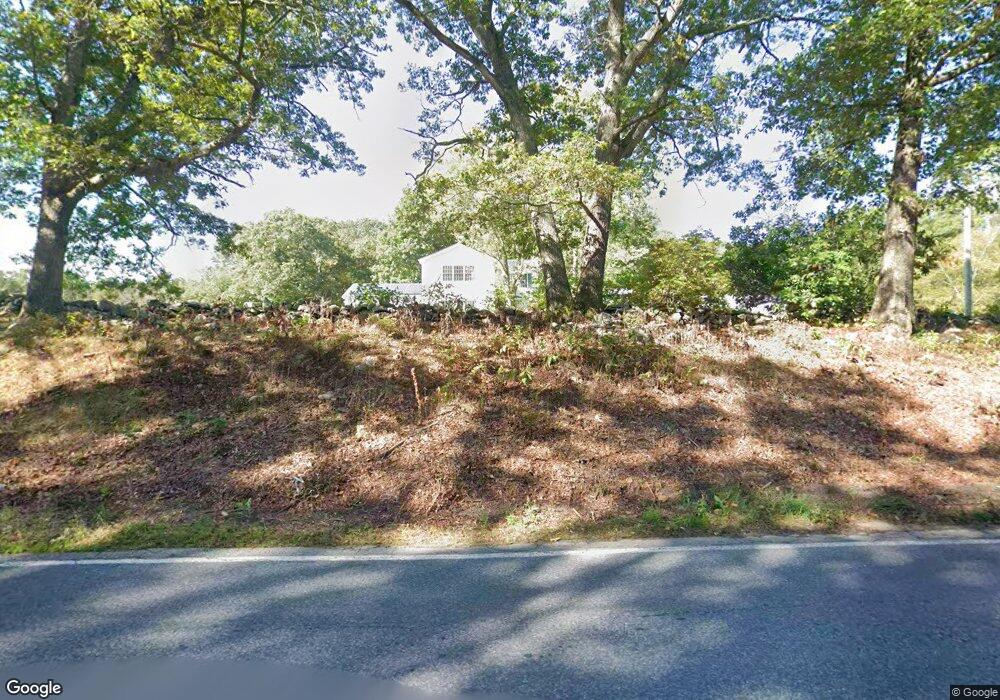
26 Pine St Rehoboth, MA 02769
Estimated Value: $765,661 - $872,000
3
Beds
4
Baths
3,500
Sq Ft
$237/Sq Ft
Est. Value
About This Home
This home is located at 26 Pine St, Rehoboth, MA 02769 and is currently estimated at $831,165, approximately $237 per square foot. 26 Pine St is a home located in Bristol County with nearby schools including Dighton-Rehoboth Regional High School, St Cecilia School, and St Margaret School.
Ownership History
Date
Name
Owned For
Owner Type
Purchase Details
Closed on
Mar 12, 2004
Sold by
Carpenter Geraldine M and Carpenter Geraldine
Bought by
Boucher Allison J and Boucher Kevin M
Current Estimated Value
Create a Home Valuation Report for This Property
The Home Valuation Report is an in-depth analysis detailing your home's value as well as a comparison with similar homes in the area
Home Values in the Area
Average Home Value in this Area
Purchase History
| Date | Buyer | Sale Price | Title Company |
|---|---|---|---|
| Boucher Allison J | -- | -- |
Source: Public Records
Tax History
| Year | Tax Paid | Tax Assessment Tax Assessment Total Assessment is a certain percentage of the fair market value that is determined by local assessors to be the total taxable value of land and additions on the property. | Land | Improvement |
|---|---|---|---|---|
| 2025 | $76 | $677,400 | $189,400 | $488,000 |
| 2024 | $7,331 | $645,300 | $189,400 | $455,900 |
| 2023 | $7,095 | $612,700 | $185,400 | $427,300 |
| 2022 | $6,753 | $533,000 | $177,000 | $356,000 |
| 2021 | $6,370 | $481,100 | $160,800 | $320,300 |
| 2020 | $4,027 | $456,200 | $160,800 | $295,400 |
| 2018 | $3,779 | $441,300 | $153,000 | $288,300 |
| 2017 | $4,736 | $377,100 | $153,000 | $224,100 |
| 2016 | $4,668 | $384,200 | $153,000 | $231,200 |
| 2015 | $4,168 | $338,600 | $145,800 | $192,800 |
| 2014 | $4,124 | $331,500 | $138,700 | $192,800 |
Source: Public Records
Map
Nearby Homes
- 377 Read St
- 16 Salisbury St
- 90 Ellis St
- 108 Homestead Ave
- 6 Cross St
- 16 Matt's Way
- 8 Matt's Way
- 11 Matt's Way
- 1150 Newman Ave
- 15 Hickory Ridge Rd
- 52 Walker St
- 191 Cherry Hill Dr
- 6 Running Stream Rd
- Lot B Burnside Ave
- 37 Colonial Way
- 52 Carpenter St
- 55 Burnside Ave
- 0
- Lot 11 Ledge Hill Ln
- 23 Colonial Way