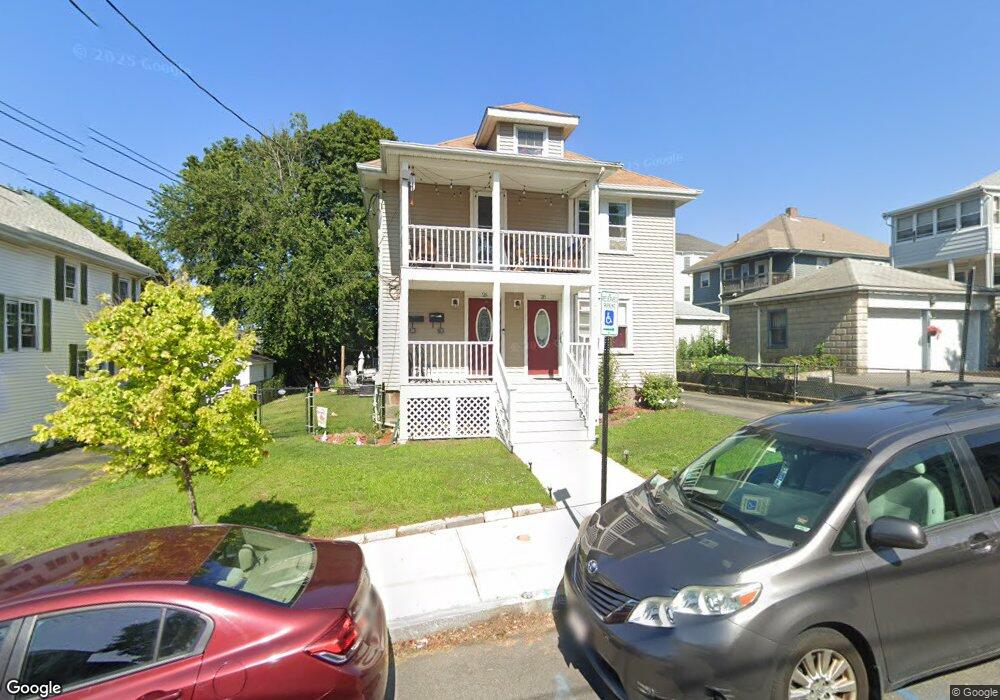
26 Plymouth St Unit 2 Quincy, MA 02169
South Quincy NeighborhoodEstimated Value: $873,052 - $1,008,000
3
Beds
1
Bath
1,100
Sq Ft
$873/Sq Ft
Est. Value
About This Home
This home is located at 26 Plymouth St Unit 2, Quincy, MA 02169 and is currently estimated at $960,513, approximately $873 per square foot. 26 Plymouth St Unit 2 is a home located in Norfolk County with nearby schools including Lincoln-Hancock Community School, South West Middle School, and Quincy High School.
Ownership History
Date
Name
Owned For
Owner Type
Purchase Details
Closed on
Jan 22, 2016
Sold by
Preston John F
Bought by
Dixon Joan M
Current Estimated Value
Purchase Details
Closed on
Sep 18, 2000
Sold by
Jck Rt
Bought by
Preston John F
Home Financials for this Owner
Home Financials are based on the most recent Mortgage that was taken out on this home.
Original Mortgage
$23,000
Interest Rate
8%
Create a Home Valuation Report for This Property
The Home Valuation Report is an in-depth analysis detailing your home's value as well as a comparison with similar homes in the area
Home Values in the Area
Average Home Value in this Area
Purchase History
| Date | Buyer | Sale Price | Title Company |
|---|---|---|---|
| Dixon Joan M | $580,000 | -- | |
| Preston John F | $281,500 | -- |
Source: Public Records
Mortgage History
| Date | Status | Borrower | Loan Amount |
|---|---|---|---|
| Previous Owner | Preston John F | $23,000 | |
| Previous Owner | Preston John F | $161,500 | |
| Previous Owner | Preston John F | $100,000 |
Source: Public Records
Tax History Compared to Growth
Tax History
| Year | Tax Paid | Tax Assessment Tax Assessment Total Assessment is a certain percentage of the fair market value that is determined by local assessors to be the total taxable value of land and additions on the property. | Land | Improvement |
|---|---|---|---|---|
| 2025 | $9,132 | $792,000 | $297,100 | $494,900 |
| 2024 | $8,598 | $762,900 | $282,900 | $480,000 |
| 2023 | $7,964 | $715,500 | $257,200 | $458,300 |
| 2022 | $7,714 | $643,900 | $214,300 | $429,600 |
| 2021 | $7,851 | $646,700 | $214,300 | $432,400 |
| 2020 | $7,781 | $626,000 | $214,300 | $411,700 |
| 2019 | $7,418 | $591,100 | $202,200 | $388,900 |
| 2018 | $6,947 | $520,800 | $187,300 | $333,500 |
| 2017 | $7,439 | $525,000 | $178,400 | $346,600 |
| 2016 | $6,563 | $457,000 | $155,100 | $301,900 |
| 2015 | $6,444 | $441,400 | $155,100 | $286,300 |
| 2014 | $5,641 | $379,600 | $155,100 | $224,500 |
Source: Public Records
Map
Nearby Homes
- 192 Federal Ave Unit B
- 52 Norman Rd
- 72 Federal Ave
- 10 Hughes St
- 195 Independence Ave Unit 137
- 218 Independence Ave Unit B
- 83 Madison Ave
- 155 Kendrick Ave Unit T7
- 166 Phipps St
- 347 Centre St
- 102 Conrad St
- 8 Jackson St Unit B2
- 161 Cedar St
- 106 Home Park Rd
- 21 Totman St Unit 204
- 21 Totman St Unit 202
- 21 Totman St Unit 309
- 21 Totman St Unit 306
- 21 Totman St Unit 410
- 21 Totman St Unit Model-1
- 26 Plymouth St
- 22 Plymouth St
- 22 Plymouth St
- 65 Verchild St
- 71 Verchild St
- 38 Plymouth St Unit 1
- 61 Verchild St
- 63 Verchild St
- 63 Verchild St Unit 1
- 61 Verchild St Unit 1
- 61 Verchild St Unit 3
- 25 Plymouth St
- 55 Verchild St
- 19 Plymouth St Unit 1L
- 31 Plymouth St
- 17 Plymouth St
- 15 Plymouth St
- 79 Verchild St
- 51 Verchild St
- 12 Plymouth St Unit 3