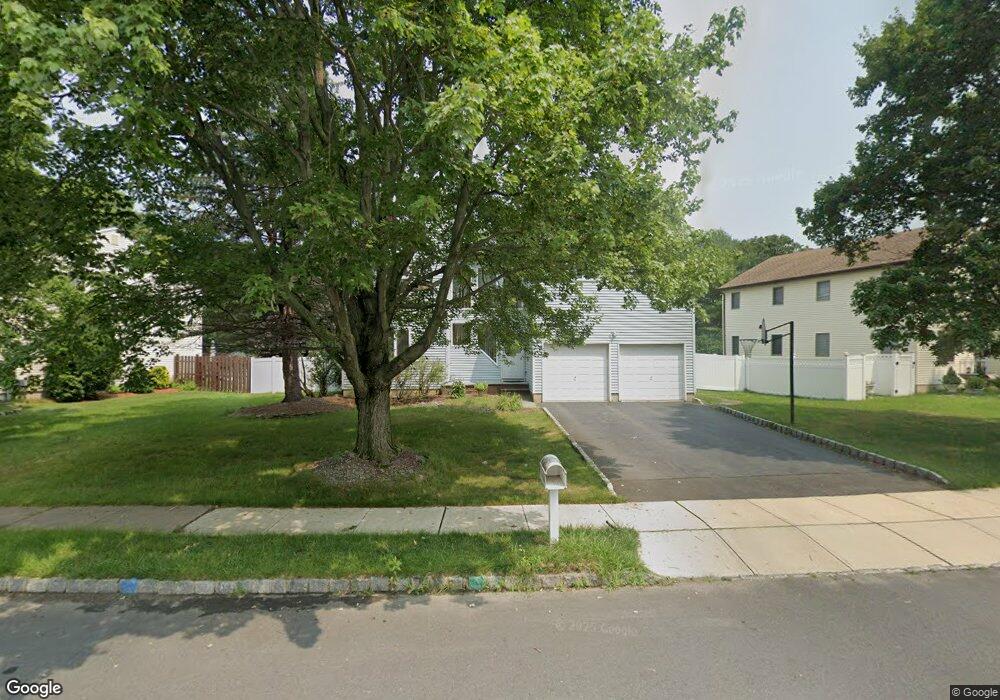
26 Pullman Loop Dayton, NJ 08810
Estimated Value: $751,000 - $875,000
4
Beds
3
Baths
2,447
Sq Ft
$338/Sq Ft
Est. Value
About This Home
This home is located at 26 Pullman Loop, Dayton, NJ 08810 and is currently estimated at $827,355, approximately $338 per square foot. 26 Pullman Loop is a home located in Middlesex County with nearby schools including Indian Fields Elementary School, Crossroads South Middle School, and South Brunswick High School.
Ownership History
Date
Name
Owned For
Owner Type
Purchase Details
Closed on
Jun 20, 2008
Sold by
Danis Stephen F and Nelson Danis Mary
Bought by
Malaviya Sanjay and Vyas Ruchi
Current Estimated Value
Home Financials for this Owner
Home Financials are based on the most recent Mortgage that was taken out on this home.
Original Mortgage
$200,000
Outstanding Balance
$43,519
Interest Rate
6.01%
Mortgage Type
Purchase Money Mortgage
Estimated Equity
$783,836
Create a Home Valuation Report for This Property
The Home Valuation Report is an in-depth analysis detailing your home's value as well as a comparison with similar homes in the area
Home Values in the Area
Average Home Value in this Area
Purchase History
| Date | Buyer | Sale Price | Title Company |
|---|---|---|---|
| Malaviya Sanjay | $455,000 | Fidelity Natl Title Ins Co |
Source: Public Records
Mortgage History
| Date | Status | Borrower | Loan Amount |
|---|---|---|---|
| Open | Malaviya Sanjay | $200,000 |
Source: Public Records
Tax History
| Year | Tax Paid | Tax Assessment Tax Assessment Total Assessment is a certain percentage of the fair market value that is determined by local assessors to be the total taxable value of land and additions on the property. | Land | Improvement |
|---|---|---|---|---|
| 2025 | $11,517 | $213,200 | $59,000 | $154,200 |
| 2024 | $11,103 | $213,200 | $59,000 | $154,200 |
Source: Public Records
Map
Nearby Homes
Your Personal Tour Guide
Ask me questions while you tour the home.