Estimated Value: $308,000 - $346,000
3
Beds
2
Baths
1,995
Sq Ft
$163/Sq Ft
Est. Value
About This Home
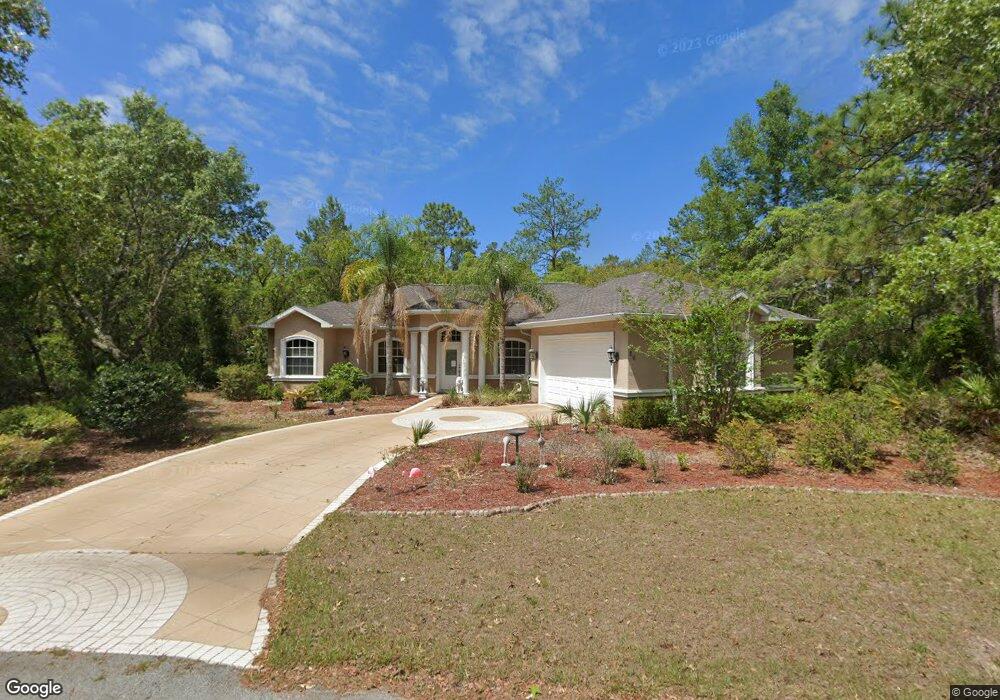
This home is located at 26 Rebecca Ct, Homosassa, FL 34446 and is currently estimated at $324,646, approximately $162 per square foot. 26 Rebecca Ct is a home located in Citrus County with nearby schools including Lecanto Primary School, Lecanto Middle School, and Lecanto High School.
Ownership History
Date
Name
Owned For
Owner Type
Purchase Details
Closed on
Sep 28, 2005
Sold by
Jillings Thomas R and Jillings Linda Ann
Bought by
Maynor Kathleen Ann
Current Estimated Value
Purchase Details
Closed on
May 10, 2005
Sold by
Nature Coast Investments
Bought by
Jillings Thomas R and Jillings Linda Ann
Home Financials for this Owner
Home Financials are based on the most recent Mortgage that was taken out on this home.
Original Mortgage
$191,900
Interest Rate
1%
Mortgage Type
FHA
Purchase Details
Closed on
Apr 12, 2005
Sold by
Gazar Moshe
Bought by
Nature Coast Investments
Home Financials for this Owner
Home Financials are based on the most recent Mortgage that was taken out on this home.
Original Mortgage
$191,900
Interest Rate
1%
Mortgage Type
FHA
Purchase Details
Closed on
Oct 21, 2003
Sold by
Cancalosi Victoria
Bought by
Gazar Moshe
Purchase Details
Closed on
Dec 1, 1989
Bought by
Maynor Kathleen Ann
Create a Home Valuation Report for This Property
The Home Valuation Report is an in-depth analysis detailing your home's value as well as a comparison with similar homes in the area
Home Values in the Area
Average Home Value in this Area
Purchase History
| Date | Buyer | Sale Price | Title Company |
|---|---|---|---|
| Maynor Kathleen Ann | $275,000 | Advance Homestead Title Inc | |
| Jillings Thomas R | $239,900 | Eagle Title & Abstract Corp | |
| Nature Coast Investments | $40,000 | -- | |
| Gazar Moshe | $6,000 | Southern Sun Title Company | |
| Maynor Kathleen Ann | $11,000 | -- |
Source: Public Records
Mortgage History
| Date | Status | Borrower | Loan Amount |
|---|---|---|---|
| Previous Owner | Jillings Thomas R | $191,900 |
Source: Public Records
Tax History Compared to Growth
Tax History
| Year | Tax Paid | Tax Assessment Tax Assessment Total Assessment is a certain percentage of the fair market value that is determined by local assessors to be the total taxable value of land and additions on the property. | Land | Improvement |
|---|---|---|---|---|
| 2024 | $1,724 | $146,951 | -- | -- |
| 2023 | $1,724 | $142,671 | $0 | $0 |
| 2022 | $1,605 | $138,516 | $0 | $0 |
| 2021 | $1,541 | $134,482 | $0 | $0 |
| 2020 | $1,479 | $182,366 | $6,230 | $176,136 |
| 2019 | $1,463 | $163,121 | $6,800 | $156,321 |
| 2018 | $1,434 | $162,340 | $6,800 | $155,540 |
| 2017 | $1,429 | $124,609 | $5,350 | $119,259 |
| 2016 | $1,442 | $122,046 | $5,080 | $116,966 |
| 2015 | $1,463 | $121,198 | $7,830 | $113,368 |
| 2014 | $1,494 | $120,236 | $7,595 | $112,641 |
Source: Public Records
Map
Nearby Homes
- 14 Rebecca Ct
- 12 Rebecca Ct
- 7293 S Suncoast Blvd
- 105 Douglas St
- 111 Douglas St
- 6950 W Sedan Ct
- 7929 S Suncoast Blvd
- 24 Boxelder Ct
- 6929 W Sedate Ct
- 3 Douglas Ct S
- 139 Douglas St
- 5 Golfview Ct
- 6979 & 6949 W Sedalia Ct
- 63 Douglas St Unit 11
- 19 Holly Ct
- Plan 2557 at Sugarmill Woods
- Plan 2430 at Sugarmill Woods
- Plan 2117 at Sugarmill Woods
- Plan 2240 at Sugarmill Woods
- Plan 2169 at Sugarmill Woods
- 22 Rebecca Ct
- 32 Rebecca Ct
- 21 Rebecca Ct
- 23 Rebecca Ct
- 31 Rebecca Ct
- 25 Rebecca Ct
- 19 Rebecca Ct
- 18 Rebecca Ct
- 7591 S Suncoast Blvd
- 15 Rebecca Ct
- 7034 W Appian St
- 13 Rebecca Ct
- 10 Laurelcherry Ct
- 9 Rebecca Ct
- 7461 S Suncoast Blvd
- 18 Laurelcherry Ct
- 7 Rebecca Ct
- 17 Laurelcherry Ct
- 6 Laurelcherry Ct
- 12 Laurelcherry Ct