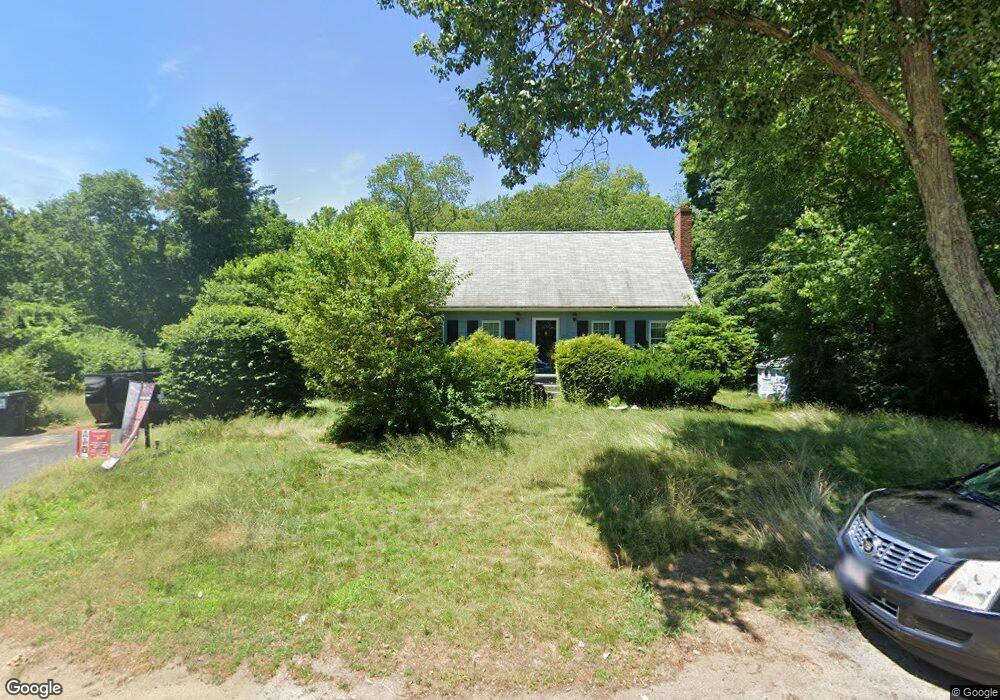
26 Reed St Hanson, MA 02341
Estimated Value: $388,000 - $674,141
3
Beds
2
Baths
1,572
Sq Ft
$362/Sq Ft
Est. Value
About This Home
This home is located at 26 Reed St, Hanson, MA 02341 and is currently estimated at $568,285, approximately $361 per square foot. 26 Reed St is a home located in Plymouth County.
Ownership History
Date
Name
Owned For
Owner Type
Purchase Details
Closed on
Jan 21, 2026
Sold by
Harleyphil Llc
Bought by
Sullivan Jason
Current Estimated Value
Home Financials for this Owner
Home Financials are based on the most recent Mortgage that was taken out on this home.
Original Mortgage
$656,882
Outstanding Balance
$656,882
Interest Rate
6.22%
Mortgage Type
FHA
Estimated Equity
-$88,597
Purchase Details
Closed on
Jun 2, 2025
Sold by
Dibble Charles F and Us Bank Tna Tr
Bought by
Harleyphil Llc
Home Financials for this Owner
Home Financials are based on the most recent Mortgage that was taken out on this home.
Original Mortgage
$351,000
Interest Rate
6.81%
Mortgage Type
Purchase Money Mortgage
Create a Home Valuation Report for This Property
The Home Valuation Report is an in-depth analysis detailing your home's value as well as a comparison with similar homes in the area
Home Values in the Area
Average Home Value in this Area
Purchase History
| Date | Buyer | Sale Price | Title Company |
|---|---|---|---|
| Sullivan Jason | $669,000 | -- | |
| Harleyphil Llc | $366,000 | None Available | |
| Harleyphil Llc | $366,000 | None Available |
Source: Public Records
Mortgage History
| Date | Status | Borrower | Loan Amount |
|---|---|---|---|
| Open | Sullivan Jason | $656,882 | |
| Previous Owner | Harleyphil Llc | $351,000 |
Source: Public Records
Tax History
| Year | Tax Paid | Tax Assessment Tax Assessment Total Assessment is a certain percentage of the fair market value that is determined by local assessors to be the total taxable value of land and additions on the property. | Land | Improvement |
|---|---|---|---|---|
| 2025 | $5,503 | $411,300 | $163,200 | $248,100 |
| 2024 | $5,344 | $399,400 | $158,500 | $240,900 |
| 2023 | $4,390 | $309,600 | $158,500 | $151,100 |
| 2022 | $4,292 | $284,400 | $144,000 | $140,400 |
| 2021 | $3,899 | $258,200 | $138,500 | $119,700 |
| 2020 | $3,848 | $252,000 | $133,800 | $118,200 |
| 2019 | $3,516 | $226,400 | $116,600 | $109,800 |
| 2018 | $3,483 | $220,000 | $112,200 | $107,800 |
| 2017 | $3,381 | $211,600 | $106,800 | $104,800 |
| 2016 | $3,457 | $208,900 | $106,800 | $102,100 |
| 2015 | $3,295 | $207,000 | $106,800 | $100,200 |
Source: Public Records
Map
Nearby Homes
- 1054 Main St
- 72 Phillips St
- 318 South St
- 143 Plymouth St
- 170 Elm St
- Lot 6 Way
- Lot 2 Harvard Rd
- 102 Leon Ct
- 115 Waltham St
- 0 Union Park St
- 361A County Rd
- 361 County Rd
- 134 Crescent St
- 61 Sawmill Ln
- 61 Sawmill Ln Unit 61
- 161 Winter St Unit 11
- 131 Elmer St
- 6 Amanda's Way Unit 6
- 0 Thompson St
- 269 Lakeside Rd
Your Personal Tour Guide
Ask me questions while you tour the home.