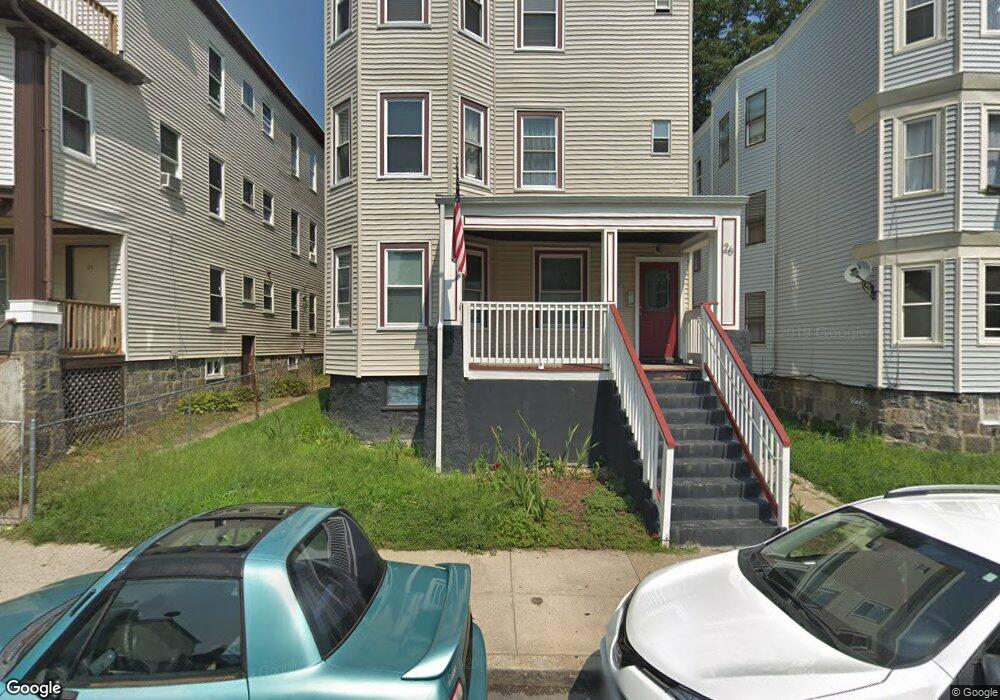
26 Ridgewood St Unit 2 Dorchester, MA 02122
Meeting House Hill NeighborhoodEstimated Value: $902,492 - $1,190,000
3
Beds
1
Bath
1,211
Sq Ft
$879/Sq Ft
Est. Value
About This Home
This home is located at 26 Ridgewood St Unit 2, Dorchester, MA 02122 and is currently estimated at $1,064,373, approximately $878 per square foot. 26 Ridgewood St Unit 2 is a home located in Suffolk County with nearby schools including UP Academy Charter School of Dorchester and Helen Y. Davis Leadership Academy Charter Public School.
Ownership History
Date
Name
Owned For
Owner Type
Purchase Details
Closed on
Dec 6, 2024
Sold by
Louis Alex P
Bought by
Alex Pierre Louis Ft and Louis
Current Estimated Value
Purchase Details
Closed on
Oct 23, 2009
Sold by
28 Ridgewood St Llc
Bought by
Keinkede Emmanuel
Home Financials for this Owner
Home Financials are based on the most recent Mortgage that was taken out on this home.
Original Mortgage
$287,300
Interest Rate
5.09%
Mortgage Type
Purchase Money Mortgage
Purchase Details
Closed on
Jul 3, 2008
Sold by
Consumer Solutions Reo
Bought by
28 Ridgewood Street Ll
Purchase Details
Closed on
Apr 14, 2008
Sold by
Dorsey Cheryl and Consumer Solution Reo
Bought by
Consumer Solution Reo
Purchase Details
Closed on
Dec 18, 2006
Sold by
Miraglia
Bought by
Dorsey Cheryl
Create a Home Valuation Report for This Property
The Home Valuation Report is an in-depth analysis detailing your home's value as well as a comparison with similar homes in the area
Home Values in the Area
Average Home Value in this Area
Purchase History
| Date | Buyer | Sale Price | Title Company |
|---|---|---|---|
| Alex Pierre Louis Ft | -- | None Available | |
| Alex Pierre Louis Ft | -- | None Available | |
| Keinkede Emmanuel | $390,000 | -- | |
| Keinkede Emmanuel | $390,000 | -- | |
| 28 Ridgewood Street Ll | $160,000 | -- | |
| 28 Ridgewood Street Ll | $160,000 | -- | |
| Consumer Solution Reo | $444,806 | -- | |
| Consumer Solution Reo | $444,806 | -- | |
| Dorsey Cheryl | $450,000 | -- | |
| Dorsey Cheryl | $450,000 | -- |
Source: Public Records
Mortgage History
| Date | Status | Borrower | Loan Amount |
|---|---|---|---|
| Previous Owner | Keinkede Emmanuel | $287,300 | |
| Previous Owner | Dorsey Cheryl | $78,000 | |
| Previous Owner | Dorsey Cheryl | $11,700 |
Source: Public Records
Tax History Compared to Growth
Tax History
| Year | Tax Paid | Tax Assessment Tax Assessment Total Assessment is a certain percentage of the fair market value that is determined by local assessors to be the total taxable value of land and additions on the property. | Land | Improvement |
|---|---|---|---|---|
| 2025 | $13,359 | $1,153,600 | $264,200 | $889,400 |
| 2024 | $12,442 | $1,141,500 | $238,700 | $902,800 |
| 2023 | $11,355 | $1,057,300 | $221,100 | $836,200 |
| 2022 | $10,458 | $961,200 | $201,000 | $760,200 |
| 2021 | $9,767 | $915,400 | $191,400 | $724,000 |
| 2020 | $8,070 | $764,200 | $213,800 | $550,400 |
| 2019 | $7,003 | $664,400 | $142,500 | $521,900 |
| 2018 | $6,215 | $593,000 | $142,500 | $450,500 |
| 2017 | $6,097 | $575,700 | $142,500 | $433,200 |
| 2016 | $5,605 | $509,500 | $142,500 | $367,000 |
| 2015 | $4,999 | $412,800 | $118,200 | $294,600 |
| 2014 | $4,634 | $368,400 | $118,200 | $250,200 |
Source: Public Records
Map
Nearby Homes
- 8 Ridgewood St
- 98 Topliff St
- 83 Topliff St
- 41 Holiday St
- 161 Westville St
- 113 Dakota St
- 31 Corona St
- 1 Dever St
- 43 Robinson St Unit 3
- 69 Mount Ida Rd Unit 1
- 53 Mount Ida Rd Unit 1
- 14 Marie St Unit 2
- 63-65 Richfield St
- 8 Arcadia St
- 1 Rock Terrace Unit 2
- 1 Rock Terrace Unit 1
- 359 Park St Unit 4
- 7 Fox St Unit 1
- 70-72 Clarkson St
- 10 Gaylord St
- 26 Ridgewood St
- 24 Ridgewood St
- 24 Ridgewood St Unit 1
- 24 Ridgewood St Unit 2
- 24 Ridgewood St Unit 3
- 30 Ridgewood St
- 32 Ridgewood St
- 13A Longfellow St
- 13 Longfellow St
- 13 Longfellow St Unit 2
- 13A Longfellow St Unit 2
- 15 Longfellow St
- 11 Longfellow St
- 19 Longfellow St
- 34 Ridgewood St
- 16 Ridgewood St
- 25 Ridgewood St
- 25 Ridgewood St Unit 2
- 25 Ridgewood St Unit 1
- 21 Ridgewood St