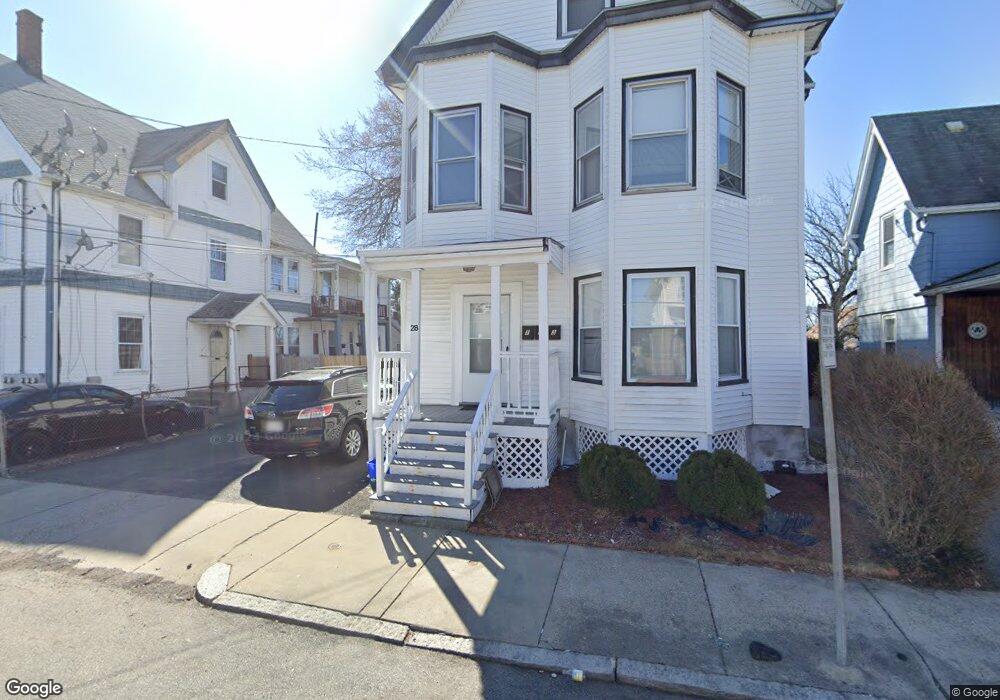
26 Ripley C-12 St Unit 28 Malden, MA 02148
Oak Grove NeighborhoodEstimated Value: $1,002,000 - $1,238,000
4
Beds
3
Baths
2,849
Sq Ft
$391/Sq Ft
Est. Value
About This Home
This home is located at 26 Ripley C-12 St Unit 28, Malden, MA 02148 and is currently estimated at $1,113,715, approximately $390 per square foot. 26 Ripley C-12 St Unit 28 is a home located in Middlesex County with nearby schools including Malden High School, Mystic Valley Regional Charter School, and Cheverus Catholic School.
Ownership History
Date
Name
Owned For
Owner Type
Purchase Details
Closed on
Jan 20, 2016
Sold by
Castillo Roberto E and Castillo Lucia
Bought by
Castillo Roberto E
Current Estimated Value
Purchase Details
Closed on
Aug 5, 2003
Sold by
Horen Sharon D
Bought by
Castillo Lucia and Castillo Roberto E
Home Financials for this Owner
Home Financials are based on the most recent Mortgage that was taken out on this home.
Original Mortgage
$375,000
Interest Rate
5.28%
Mortgage Type
Purchase Money Mortgage
Create a Home Valuation Report for This Property
The Home Valuation Report is an in-depth analysis detailing your home's value as well as a comparison with similar homes in the area
Home Values in the Area
Average Home Value in this Area
Purchase History
| Date | Buyer | Sale Price | Title Company |
|---|---|---|---|
| Castillo Roberto E | -- | -- | |
| Castillo Lucia | $500,000 | -- |
Source: Public Records
Mortgage History
| Date | Status | Borrower | Loan Amount |
|---|---|---|---|
| Previous Owner | Castillo Lucia | $375,000 |
Source: Public Records
Tax History Compared to Growth
Tax History
| Year | Tax Paid | Tax Assessment Tax Assessment Total Assessment is a certain percentage of the fair market value that is determined by local assessors to be the total taxable value of land and additions on the property. | Land | Improvement |
|---|---|---|---|---|
| 2025 | $10,550 | $932,000 | $287,000 | $645,000 |
| 2024 | $10,263 | $877,900 | $271,100 | $606,800 |
| 2023 | $9,957 | $816,800 | $247,200 | $569,600 |
| 2022 | $9,564 | $774,400 | $223,300 | $551,100 |
| 2021 | $9,964 | $810,700 | $199,300 | $611,400 |
| 2020 | $9,648 | $762,700 | $192,600 | $570,100 |
| 2019 | $8,957 | $675,000 | $183,400 | $491,600 |
| 2018 | $8,678 | $615,900 | $151,500 | $464,400 |
| 2017 | $8,333 | $588,100 | $145,500 | $442,600 |
| 2016 | $6,529 | $430,700 | $133,600 | $297,100 |
| 2015 | $6,319 | $401,700 | $127,200 | $274,500 |
| 2014 | $5,952 | $369,700 | $115,600 | $254,100 |
Source: Public Records
Map
Nearby Homes
- 23 Orient St
- 1 Glenwood St Unit 3
- 131 Linden Ave
- 91-93 Beltran St
- 20 Washington Place
- 14 Holm Ct Unit 2
- 94 Mount Vernon St Unit 94
- 30 Wallace Cir
- 11-13 Hudson St
- 29 Lincoln St
- 41 Mountain Ave
- 11 Starbird St
- 30-32 Starbird St
- 43 Park St
- 37-39 Park St
- 20 Rockland Ave Unit 3
- 197 Clifton St Unit 4
- 58 Clark St
- 20 Chestnut St Unit 205
- 141 Pierce St Unit 25
- 28 Ripley St Unit 3
- 28 Ripley St Unit 1
- 28 Ripley St Unit 3
- 28 Ripley St
- 28 Ripley St Unit 1
- 26-28-28 Ripley St Unit 2
- 32 Ripley St
- 22 Ripley St Unit 1
- 22 Ripley St
- 24 Ripley St
- 22 Ripley St Unit 2
- 36 Ripley St
- 36 Ripley St
- 20 Ripley C-12 St
- 20 Ripley C-12 St Unit 1
- 20 Ripley St Unit 1
- 29 Edmund St
- 33 Edmund St
- 18-20 Ripley St
- 27 Ripley St