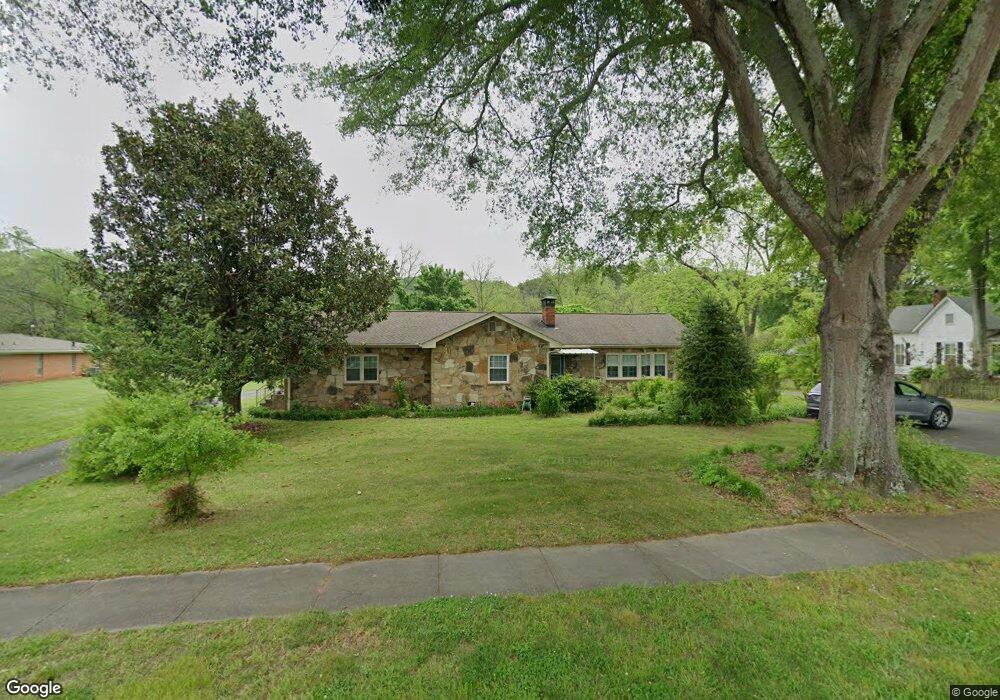
26 Rome Rd SW Cave Spring, GA 30124
Estimated Value: $245,993 - $410,000
--
Bed
3
Baths
2,176
Sq Ft
$147/Sq Ft
Est. Value
About This Home
This home is located at 26 Rome Rd SW, Cave Spring, GA 30124 and is currently estimated at $320,248, approximately $147 per square foot. 26 Rome Rd SW is a home with nearby schools including Coosa Middle School and Coosa High School.
Ownership History
Date
Name
Owned For
Owner Type
Purchase Details
Closed on
Jul 29, 2020
Sold by
Harbin Courtney J
Bought by
Harbin Courtney Janel and Harbin Warren Baker
Current Estimated Value
Home Financials for this Owner
Home Financials are based on the most recent Mortgage that was taken out on this home.
Original Mortgage
$135,000
Outstanding Balance
$118,390
Interest Rate
3%
Mortgage Type
New Conventional
Estimated Equity
$201,858
Purchase Details
Closed on
Feb 11, 2016
Sold by
Musick Jan Jennings
Bought by
Harbin Courtney J
Home Financials for this Owner
Home Financials are based on the most recent Mortgage that was taken out on this home.
Original Mortgage
$30,000
Interest Rate
3.92%
Mortgage Type
New Conventional
Purchase Details
Closed on
May 22, 2006
Sold by
Not Provided
Bought by
Musick Jan Jennings
Home Financials for this Owner
Home Financials are based on the most recent Mortgage that was taken out on this home.
Original Mortgage
$95,000
Interest Rate
6.44%
Mortgage Type
New Conventional
Create a Home Valuation Report for This Property
The Home Valuation Report is an in-depth analysis detailing your home's value as well as a comparison with similar homes in the area
Home Values in the Area
Average Home Value in this Area
Purchase History
| Date | Buyer | Sale Price | Title Company |
|---|---|---|---|
| Harbin Courtney Janel | -- | -- | |
| Harbin Courtney J | $105,000 | -- | |
| Musick Jan Jennings | $95,000 | -- |
Source: Public Records
Mortgage History
| Date | Status | Borrower | Loan Amount |
|---|---|---|---|
| Open | Harbin Courtney Janel | $135,000 | |
| Previous Owner | Harbin Courtney J | $30,000 | |
| Previous Owner | Musick Jan Jennings | $95,000 |
Source: Public Records
Tax History Compared to Growth
Tax History
| Year | Tax Paid | Tax Assessment Tax Assessment Total Assessment is a certain percentage of the fair market value that is determined by local assessors to be the total taxable value of land and additions on the property. | Land | Improvement |
|---|---|---|---|---|
| 2024 | $2,319 | $103,703 | $7,344 | $96,359 |
| 2023 | $2,284 | $102,839 | $6,214 | $96,625 |
| 2022 | $1,727 | $87,721 | $5,085 | $82,636 |
| 2021 | $1,660 | $67,016 | $4,520 | $62,496 |
| 2020 | $1,596 | $62,758 | $3,390 | $59,368 |
| 2019 | $1,520 | $59,599 | $3,390 | $56,209 |
| 2018 | $1,463 | $56,365 | $3,390 | $52,975 |
| 2017 | $1,085 | $43,939 | $3,390 | $40,549 |
| 2016 | $1,147 | $40,716 | $16,520 | $24,196 |
| 2015 | -- | $40,716 | $16,520 | $24,196 |
| 2014 | -- | $40,716 | $16,520 | $24,196 |
Source: Public Records
Map
Nearby Homes
- 104 Fincher St
- 22 River St SW
- 57 Mill St
- 0 Mill Rd Unit 10629874
- 0 Mill Rd Unit 7670319
- 8876 Cave Spring Rd SW
- 10 Ridge Rd SW
- 8876 Cave Spring
- 7 Herschel Mize Dr SW
- 7 Herschel Mize Dr
- 5677 Fosters Mill Rd SW
- 5598 Fosters Mill Rd
- 0 Melson Rd SW Unit 7676052
- 0 Melson Rd SW Unit 10636997
- 907 Gadsden Rd SW
- 424 Michael Blvd
- 123 Santa Claus Rd
- 0 McGee Bend Rd SW Unit 10351960
- 383 Valley Grove Rd
- 100 Lee Ave