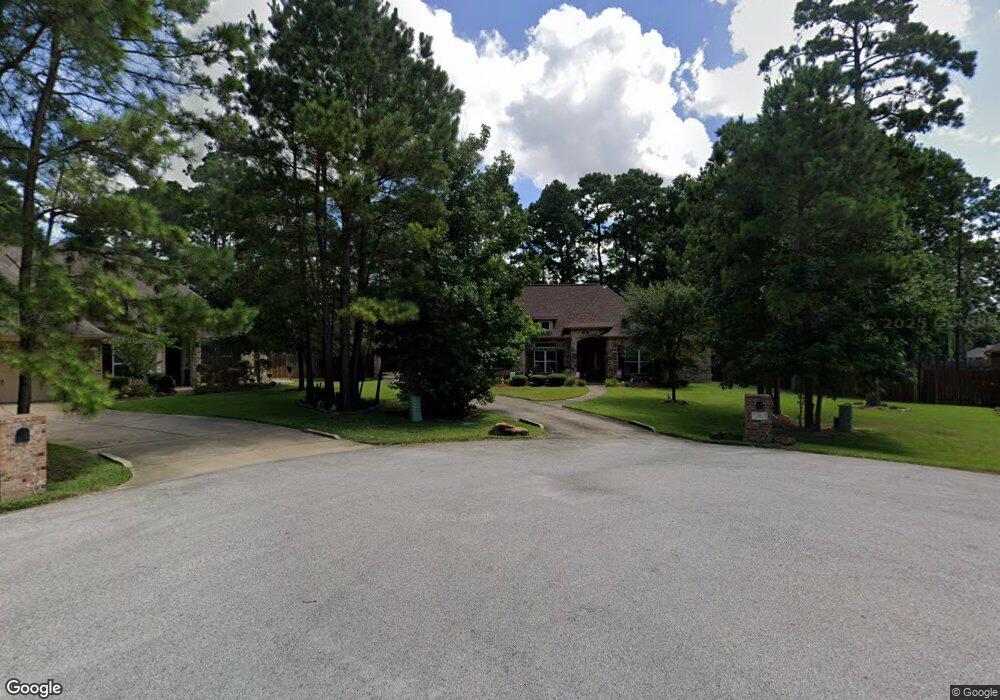
26 Rose Pine Ct Magnolia, TX 77355
Estimated Value: $416,065 - $541,000
--
Bed
--
Bath
2,378
Sq Ft
$202/Sq Ft
Est. Value
About This Home
This home is located at 26 Rose Pine Ct, Magnolia, TX 77355 and is currently estimated at $481,516, approximately $202 per square foot. 26 Rose Pine Ct is a home located in Montgomery County with nearby schools including Nichols Sawmill Elementary School, Magnolia Sixth Grade Campus, and Magnolia Junior High School.
Ownership History
Date
Name
Owned For
Owner Type
Purchase Details
Closed on
Jul 13, 2015
Sold by
Rvision Jma/Hp Llc
Bought by
Wilson Lucky Travis and Wilson Pamela Ethel
Current Estimated Value
Home Financials for this Owner
Home Financials are based on the most recent Mortgage that was taken out on this home.
Original Mortgage
$248,208
Outstanding Balance
$193,808
Interest Rate
3.9%
Mortgage Type
New Conventional
Estimated Equity
$287,708
Purchase Details
Closed on
Jan 8, 2015
Sold by
Maritia Lp
Bought by
R Vision Jma Hp Llc
Home Financials for this Owner
Home Financials are based on the most recent Mortgage that was taken out on this home.
Original Mortgage
$235,000
Interest Rate
3.97%
Mortgage Type
Construction
Purchase Details
Closed on
Jul 30, 2014
Sold by
Windfern Const Co Ltd
Bought by
Wilson Lucky T and Wilson Pamela E
Create a Home Valuation Report for This Property
The Home Valuation Report is an in-depth analysis detailing your home's value as well as a comparison with similar homes in the area
Home Values in the Area
Average Home Value in this Area
Purchase History
| Date | Buyer | Sale Price | Title Company |
|---|---|---|---|
| Wilson Lucky Travis | -- | Itc | |
| R Vision Jma Hp Llc | -- | Fidelity National Title | |
| Wilson Lucky T | -- | -- | |
| Wilson Lucky T | -- | -- |
Source: Public Records
Mortgage History
| Date | Status | Borrower | Loan Amount |
|---|---|---|---|
| Open | Wilson Lucky Travis | $248,208 | |
| Previous Owner | Wilson Lucky T | $235,000 |
Source: Public Records
Tax History Compared to Growth
Tax History
| Year | Tax Paid | Tax Assessment Tax Assessment Total Assessment is a certain percentage of the fair market value that is determined by local assessors to be the total taxable value of land and additions on the property. | Land | Improvement |
|---|---|---|---|---|
| 2025 | $10,167 | $489,598 | $91,463 | $398,135 |
| 2024 | $5,101 | $448,866 | -- | -- |
| 2023 | $5,101 | $408,060 | $91,460 | $363,610 |
| 2022 | $10,701 | $370,960 | $60,980 | $363,610 |
| 2021 | $10,045 | $337,240 | $60,980 | $276,260 |
| 2020 | $10,314 | $318,960 | $60,980 | $257,980 |
| 2019 | $10,007 | $310,400 | $60,980 | $249,420 |
| 2018 | $9,085 | $293,150 | $60,980 | $232,170 |
| 2017 | $10,398 | $308,500 | $60,980 | $247,520 |
| 2016 | $10,399 | $308,530 | $15,000 | $293,530 |
| 2015 | $331 | $9,750 | $9,750 | $0 |
| 2014 | $331 | $9,750 | $9,750 | $0 |
Source: Public Records
Map
Nearby Homes
- 42 Brookefield Cir
- 0 Country Place Unit 33111380
- 28915 Pine Forest Dr
- 59 Beaconsfield Dr
- 18903 Veterans Rd
- 28915 Forest Hill Dr
- TBD Legacy Ct
- 29010 Legacy Ct
- 29924 Nichols Sawmills
- 19803 Ruby Terrace Ln
- 28046 Crossway Oaks
- 28028 Crossway Oaks
- 18919 S Sapling Oaks Place
- 18910 S Sapling Oaks Place
- 30119 Saw Oaks Dr
- 18915 Veterans Rd
- 16715 Frosted Evergreen Ct
- 30106 Saw Oaks Dr
- 30023 Saw Oaks Dr
- 18934 Cluster Oaks Dr
- 18 18 Woodbury Ct
- 18 Woodbury Ct
- 30 Rose Pine Ct
- 22 Rose Pine Ct
- 22 Woodbury Ct
- 22 Woodbury Ct
- 25 Cloverleaf Ct
- 27 Rose Pine Ct
- 63 Brookefield Cir
- 18 Rose Pine Ct
- 59 Brookefield Cir
- 23 Rose Pine Ct
- 21 Cloverleaf Ct
- 29 Cloverleaf Ct
- 19 Woodbury Ct
- 14 Rose Pine Ct
- 26 Cloverleaf Ct
- 17 Cloverleaf Ct
- 51 Brookefield Cir
- 22 Cloverleaf Ct