Estimated Value: $1,039,037
--
Bed
--
Bath
6,781
Sq Ft
$153/Sq Ft
Est. Value
About This Home
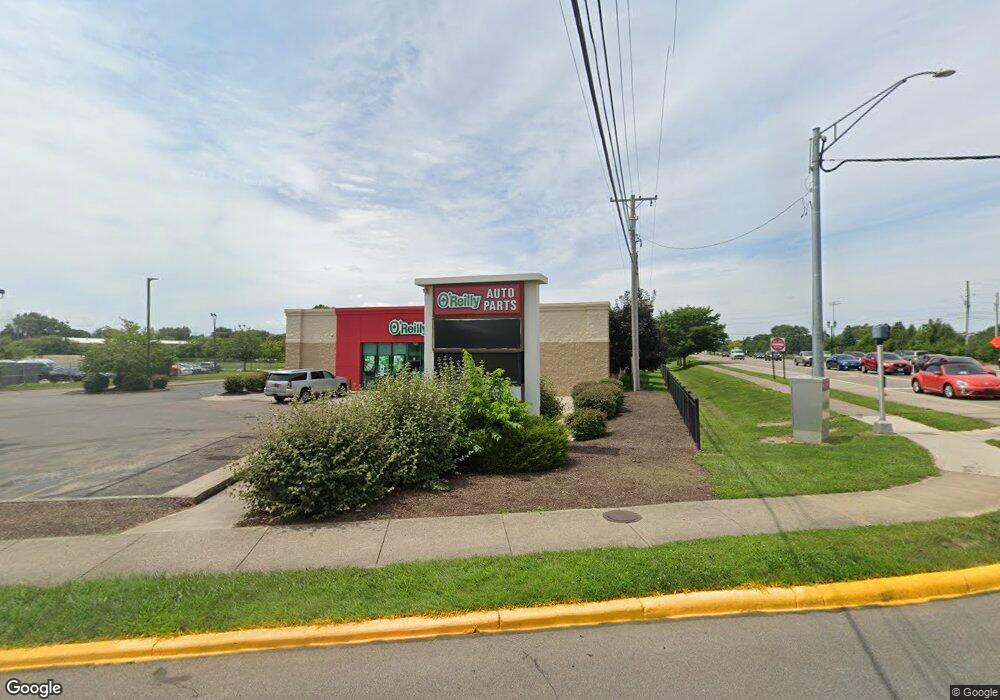
This home is located at 26 S Allison Ave, Xenia, OH 45385 and is currently estimated at $1,039,037, approximately $153 per square foot. 26 S Allison Ave is a home located in Greene County with nearby schools including Xenia High School, Summit Academy Community School for Alternative Learners - Xenia, and Legacy Christian Academy.
Ownership History
Date
Name
Owned For
Owner Type
Purchase Details
Closed on
Jun 2, 2014
Sold by
Grady Maureen A and Brosnan Michael J
Bought by
Oreilly Auto Enterprises Llc
Current Estimated Value
Purchase Details
Closed on
Nov 1, 2007
Sold by
Mitchell Peterson Inc
Bought by
Grady Maureen A and Brosnan Michael J
Home Financials for this Owner
Home Financials are based on the most recent Mortgage that was taken out on this home.
Original Mortgage
$765,000
Interest Rate
6.45%
Mortgage Type
Commercial
Create a Home Valuation Report for This Property
The Home Valuation Report is an in-depth analysis detailing your home's value as well as a comparison with similar homes in the area
Home Values in the Area
Average Home Value in this Area
Purchase History
| Date | Buyer | Sale Price | Title Company |
|---|---|---|---|
| Oreilly Auto Enterprises Llc | $475,000 | None Available | |
| Grady Maureen A | $1,165,000 | Attorney |
Source: Public Records
Mortgage History
| Date | Status | Borrower | Loan Amount |
|---|---|---|---|
| Previous Owner | Grady Maureen A | $765,000 |
Source: Public Records
Tax History Compared to Growth
Tax History
| Year | Tax Paid | Tax Assessment Tax Assessment Total Assessment is a certain percentage of the fair market value that is determined by local assessors to be the total taxable value of land and additions on the property. | Land | Improvement |
|---|---|---|---|---|
| 2024 | $11,524 | $227,470 | $65,400 | $162,070 |
| 2023 | $11,524 | $227,470 | $65,400 | $162,070 |
| 2022 | $12,783 | $214,770 | $65,400 | $149,370 |
| 2021 | $12,981 | $214,770 | $65,400 | $149,370 |
| 2020 | $12,613 | $214,770 | $65,400 | $149,370 |
| 2019 | $12,613 | $208,420 | $65,400 | $143,020 |
| 2018 | $12,722 | $208,420 | $65,400 | $143,020 |
| 2017 | $12,564 | $208,420 | $65,400 | $143,020 |
| 2016 | $12,564 | $204,090 | $65,400 | $138,690 |
| 2015 | $5,054 | $163,650 | $65,400 | $98,250 |
| 2014 | $4,881 | $163,650 | $65,400 | $98,250 |
Source: Public Records
Map
Nearby Homes