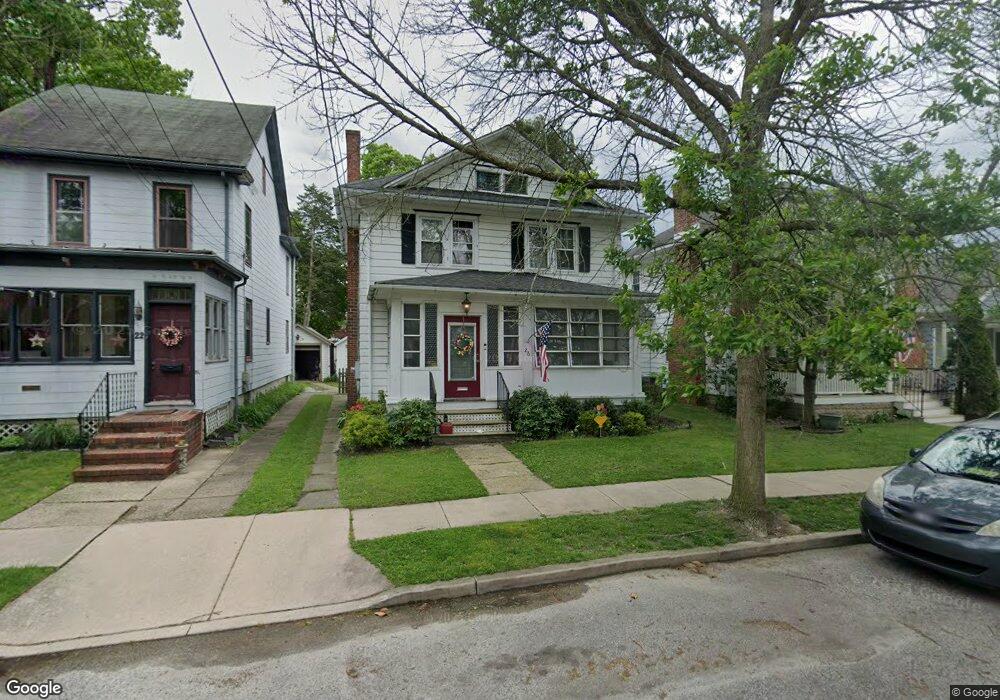
26 S Davis St Woodbury, NJ 08096
Estimated Value: $261,000 - $319,000
--
Bed
--
Bath
1,294
Sq Ft
$223/Sq Ft
Est. Value
About This Home
This home is located at 26 S Davis St, Woodbury, NJ 08096 and is currently estimated at $287,919, approximately $222 per square foot. 26 S Davis St is a home located in Gloucester County with nearby schools including Woodbury Junior/Senior High School and Holy Angels Catholic School.
Ownership History
Date
Name
Owned For
Owner Type
Purchase Details
Closed on
Jul 26, 2000
Sold by
Miller Elaine and Miller Daniel
Bought by
Suloff Mark R and Suloff Louise M
Current Estimated Value
Home Financials for this Owner
Home Financials are based on the most recent Mortgage that was taken out on this home.
Original Mortgage
$102,403
Outstanding Balance
$36,816
Interest Rate
8.1%
Mortgage Type
FHA
Estimated Equity
$251,103
Purchase Details
Closed on
Oct 10, 1995
Sold by
Decesari Elaine D
Bought by
Eshelman Elaine
Create a Home Valuation Report for This Property
The Home Valuation Report is an in-depth analysis detailing your home's value as well as a comparison with similar homes in the area
Home Values in the Area
Average Home Value in this Area
Purchase History
| Date | Buyer | Sale Price | Title Company |
|---|---|---|---|
| Suloff Mark R | $102,500 | Pilgrim Title Agency | |
| Eshelman Elaine | $93,000 | Fidelity Title Abstract Co |
Source: Public Records
Mortgage History
| Date | Status | Borrower | Loan Amount |
|---|---|---|---|
| Open | Suloff Mark R | $102,403 |
Source: Public Records
Tax History Compared to Growth
Tax History
| Year | Tax Paid | Tax Assessment Tax Assessment Total Assessment is a certain percentage of the fair market value that is determined by local assessors to be the total taxable value of land and additions on the property. | Land | Improvement |
|---|---|---|---|---|
| 2025 | $6,601 | $137,200 | $38,900 | $98,300 |
| 2024 | $6,366 | $137,200 | $38,900 | $98,300 |
| 2023 | $6,366 | $137,200 | $38,900 | $98,300 |
| 2022 | $6,254 | $137,200 | $38,900 | $98,300 |
| 2021 | $5,988 | $137,200 | $38,900 | $98,300 |
| 2020 | $6,010 | $121,700 | $32,400 | $89,300 |
| 2019 | $5,674 | $118,900 | $32,400 | $86,500 |
| 2018 | $5,548 | $118,900 | $32,400 | $86,500 |
| 2017 | $5,454 | $118,900 | $32,400 | $86,500 |
| 2016 | $5,378 | $118,900 | $32,400 | $86,500 |
| 2015 | $5,290 | $117,900 | $32,400 | $85,500 |
| 2014 | $5,163 | $117,900 | $32,400 | $85,500 |
Source: Public Records
Map
Nearby Homes