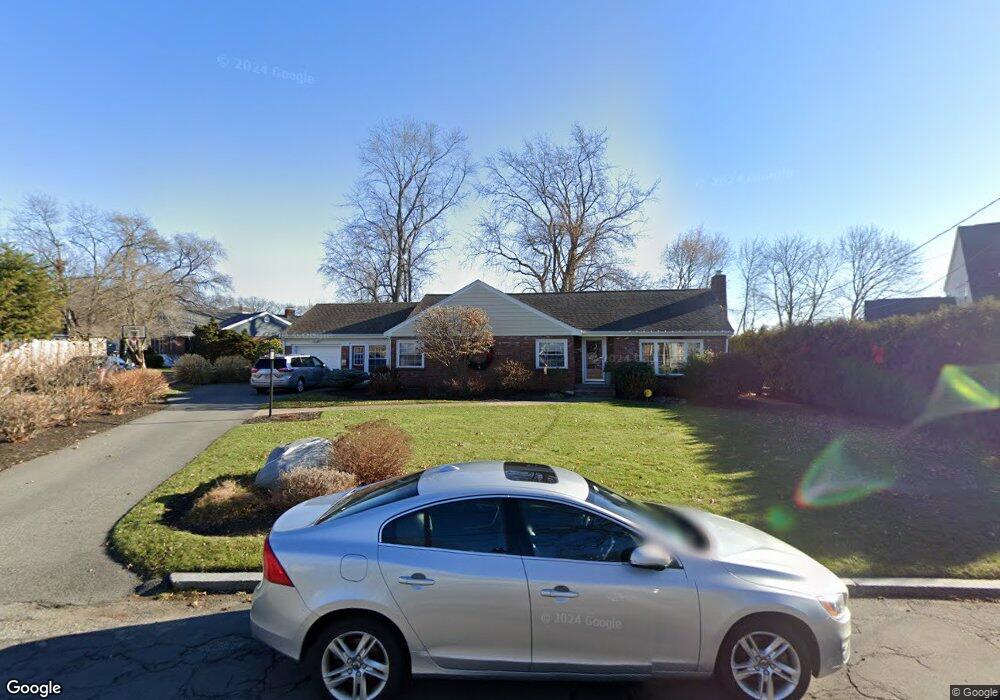
26 S Gateway Winchester, MA 01890
Symmes Corner NeighborhoodEstimated Value: $1,394,000 - $1,708,000
3
Beds
3
Baths
2,387
Sq Ft
$648/Sq Ft
Est. Value
About This Home
This home is located at 26 S Gateway, Winchester, MA 01890 and is currently estimated at $1,546,403, approximately $647 per square foot. 26 S Gateway is a home located in Middlesex County with nearby schools including Ambrose Elementary School, McCall Middle School, and Winchester High School.
Ownership History
Date
Name
Owned For
Owner Type
Purchase Details
Closed on
Apr 5, 2024
Sold by
Roller Brian W and Roller Andrea D
Bought by
Brian W Roller Lt and Roller
Current Estimated Value
Purchase Details
Closed on
Aug 24, 2007
Sold by
Clarke Alicia C and Clarke Dennis A
Bought by
Roller Andrea D and Roller Brian W
Home Financials for this Owner
Home Financials are based on the most recent Mortgage that was taken out on this home.
Original Mortgage
$350,000
Interest Rate
6.78%
Mortgage Type
Purchase Money Mortgage
Purchase Details
Closed on
Sep 22, 1995
Sold by
Blotnick Rt and Bernstein
Bought by
Clarke Dennis A and Clarke Alicia S
Create a Home Valuation Report for This Property
The Home Valuation Report is an in-depth analysis detailing your home's value as well as a comparison with similar homes in the area
Home Values in the Area
Average Home Value in this Area
Purchase History
| Date | Buyer | Sale Price | Title Company |
|---|---|---|---|
| Brian W Roller Lt | -- | None Available | |
| Brian W Roller Lt | -- | None Available | |
| Brian W Roller Lt | -- | None Available | |
| Roller Andrea D | $690,000 | -- | |
| Roller Andrea D | $690,000 | -- | |
| Roller Andrea D | $690,000 | -- | |
| Clarke Dennis A | $342,000 | -- |
Source: Public Records
Mortgage History
| Date | Status | Borrower | Loan Amount |
|---|---|---|---|
| Previous Owner | Clarke Dennis A | $356,000 | |
| Previous Owner | Clarke Dennis A | $360,000 | |
| Previous Owner | Roller Andrea D | $350,000 |
Source: Public Records
Tax History
| Year | Tax Paid | Tax Assessment Tax Assessment Total Assessment is a certain percentage of the fair market value that is determined by local assessors to be the total taxable value of land and additions on the property. | Land | Improvement |
|---|---|---|---|---|
| 2025 | $148 | $1,330,900 | $906,300 | $424,600 |
| 2024 | $15,039 | $1,327,400 | $906,900 | $420,500 |
| 2023 | $14,023 | $1,188,400 | $798,100 | $390,300 |
| 2022 | $13,892 | $1,110,500 | $725,500 | $385,000 |
| 2021 | $12,349 | $1,038,000 | $653,000 | $385,000 |
| 2020 | $12,861 | $1,038,000 | $653,000 | $385,000 |
| 2019 | $11,691 | $965,400 | $580,400 | $385,000 |
| 2018 | $11,303 | $887,700 | $524,200 | $363,500 |
| 2017 | $9,998 | $814,200 | $450,700 | $363,500 |
| 2016 | $8,928 | $764,400 | $424,400 | $340,000 |
| 2015 | $9,280 | $764,400 | $424,400 | $340,000 |
| 2014 | $8,337 | $658,500 | $353,700 | $304,800 |
Source: Public Records
Map
Nearby Homes
- 1 Town Way
- 2 Priscilla Ln
- 19 Town Way
- 6 Marchant Rd
- 53 Winford Way
- 39 Town Way
- 17 Cranston Rd
- 61 Grove St
- 545 Winthrop St Unit Lot 6
- 545 Winthrop St Unit Lot 8
- 545 Winthrop St Unit Lot 7
- 2 Canterbury Rd
- 35 Hollywood Rd
- 14 Symmes St
- 20 Grove Place
- 40 Century St
- 4 Leslie Rd
- 9 Lakeview Terrace
- 14 Ivy Rd
- 45 Bacon St
Your Personal Tour Guide
Ask me questions while you tour the home.