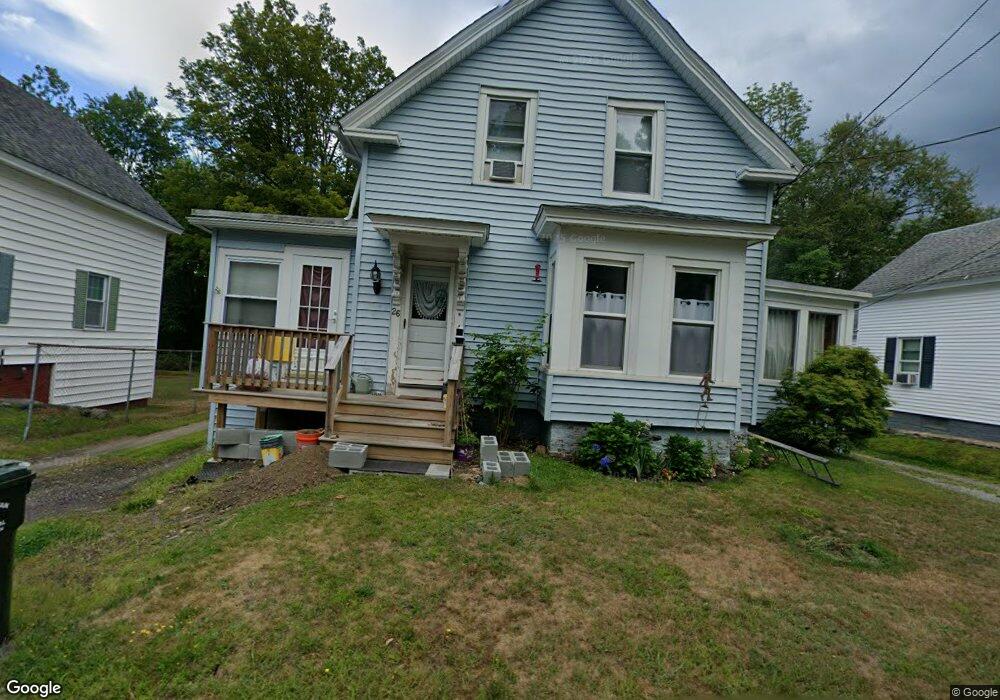
26 S Main St Ashburnham, MA 01430
Estimated Value: $276,844 - $357,000
4
Beds
1
Bath
1,240
Sq Ft
$243/Sq Ft
Est. Value
About This Home
This home is located at 26 S Main St, Ashburnham, MA 01430 and is currently estimated at $301,461, approximately $243 per square foot. 26 S Main St is a home located in Worcester County with nearby schools including Oakmont Regional High School, Wachusett Hills Christian School, and Cushing Academy.
Ownership History
Date
Name
Owned For
Owner Type
Purchase Details
Closed on
Oct 31, 2005
Sold by
White A Dexter A and White Christine E
Bought by
Derby David R and Robichaud Veronica L
Current Estimated Value
Home Financials for this Owner
Home Financials are based on the most recent Mortgage that was taken out on this home.
Original Mortgage
$167,980
Outstanding Balance
$86,741
Interest Rate
5.79%
Mortgage Type
Purchase Money Mortgage
Estimated Equity
$214,720
Create a Home Valuation Report for This Property
The Home Valuation Report is an in-depth analysis detailing your home's value as well as a comparison with similar homes in the area
Home Values in the Area
Average Home Value in this Area
Purchase History
| Date | Buyer | Sale Price | Title Company |
|---|---|---|---|
| Derby David R | $170,617 | -- | |
| Derby David R | $170,617 | -- |
Source: Public Records
Mortgage History
| Date | Status | Borrower | Loan Amount |
|---|---|---|---|
| Open | Derby David R | $167,980 | |
| Closed | Derby David R | $167,980 | |
| Previous Owner | Derby David R | $114,000 | |
| Previous Owner | Derby David R | $54,500 |
Source: Public Records
Tax History
| Year | Tax Paid | Tax Assessment Tax Assessment Total Assessment is a certain percentage of the fair market value that is determined by local assessors to be the total taxable value of land and additions on the property. | Land | Improvement |
|---|---|---|---|---|
| 2025 | $3,472 | $233,500 | $30,400 | $203,100 |
| 2024 | $3,399 | $215,800 | $30,400 | $185,400 |
| 2023 | $3,471 | $209,700 | $30,400 | $179,300 |
| 2022 | $3,472 | $183,900 | $29,500 | $154,400 |
| 2021 | $10,059 | $167,600 | $29,500 | $138,100 |
| 2020 | $3,369 | $167,600 | $29,500 | $138,100 |
| 2019 | $3,105 | $137,700 | $29,500 | $108,200 |
| 2018 | $9,550 | $129,100 | $28,000 | $101,100 |
| 2017 | $3,110 | $135,400 | $35,300 | $100,100 |
| 2016 | $3,051 | $134,100 | $34,600 | $99,500 |
| 2015 | $2,988 | $134,100 | $34,600 | $99,500 |
Source: Public Records
Map
Nearby Homes
- 441 S Ashburnham Rd
- Lot 6 Suffolk Ln
- Lot 5 Suffolk Ln
- 15 Kirali Ct
- 75 Willard Rd
- 141 Opal Ln
- 9 Willard Rd
- 149 Bragg Hill Rd
- 100 Main St
- 14 Central St
- 117 Topaz Terrace
- 102 Topaz Terrace
- Lot 40C Winchendon Rd
- 280 Stone St
- 2 Stone St
- 53 Ridgewood Ln Unit 16
- 38 Foster Ct
- 41 Betty Spring Rd
- 57 Ashby Rd
- 189 Fitchburg Rd
Your Personal Tour Guide
Ask me questions while you tour the home.