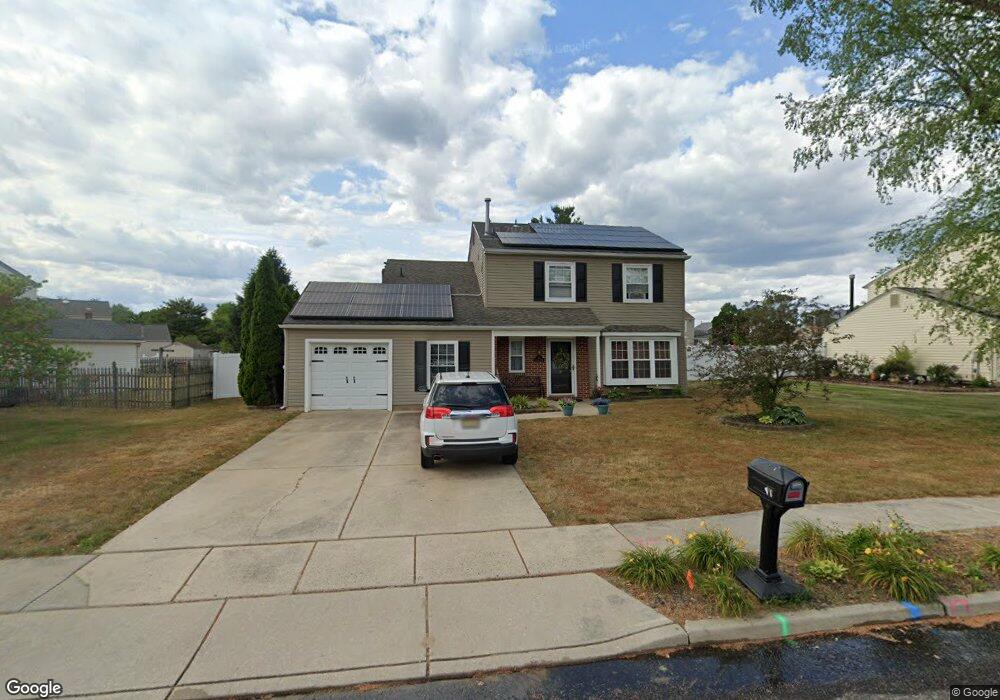
26 S Mars Dr Sewell, NJ 08080
Estimated Value: $364,793 - $484,000
Studio
--
Bath
1,812
Sq Ft
$235/Sq Ft
Est. Value
About This Home
This home is located at 26 S Mars Dr, Sewell, NJ 08080 and is currently estimated at $426,698, approximately $235 per square foot. 26 S Mars Dr is a home located in Gloucester County with nearby schools including Washington Township High School, Thomas Jefferson Elementary School, and Orchard Valley Middle School.
Ownership History
Date
Name
Owned For
Owner Type
Purchase Details
Closed on
Mar 10, 1998
Sold by
World S & L Assn
Bought by
Irwin Robert J and Cammorata Rosemary
Current Estimated Value
Home Financials for this Owner
Home Financials are based on the most recent Mortgage that was taken out on this home.
Original Mortgage
$93,200
Outstanding Balance
$16,854
Interest Rate
6.89%
Estimated Equity
$409,844
Purchase Details
Closed on
Oct 21, 1997
Sold by
Gill Charles W
Bought by
World S/L
Home Financials for this Owner
Home Financials are based on the most recent Mortgage that was taken out on this home.
Original Mortgage
$141,460
Interest Rate
7.28%
Create a Home Valuation Report for This Property
The Home Valuation Report is an in-depth analysis detailing your home's value as well as a comparison with similar homes in the area
Home Values in the Area
Average Home Value in this Area
Purchase History
| Date | Buyer | Sale Price | Title Company |
|---|---|---|---|
| Irwin Robert J | $116,500 | -- | |
| World S/L | -- | -- |
Source: Public Records
Mortgage History
| Date | Status | Borrower | Loan Amount |
|---|---|---|---|
| Open | Irwin Robert J | $93,200 | |
| Previous Owner | World S/L | $141,460 |
Source: Public Records
Tax History
| Year | Tax Paid | Tax Assessment Tax Assessment Total Assessment is a certain percentage of the fair market value that is determined by local assessors to be the total taxable value of land and additions on the property. | Land | Improvement |
|---|---|---|---|---|
| 2025 | $7,834 | $211,800 | $55,800 | $156,000 |
| 2024 | $7,614 | $211,800 | $55,800 | $156,000 |
| 2023 | $7,614 | $211,800 | $55,800 | $156,000 |
| 2022 | $7,364 | $211,800 | $55,800 | $156,000 |
| 2021 | $5,426 | $211,800 | $55,800 | $156,000 |
| 2020 | $7,161 | $211,800 | $55,800 | $156,000 |
| 2019 | $6,572 | $180,300 | $35,800 | $144,500 |
| 2018 | $6,498 | $180,300 | $35,800 | $144,500 |
| 2017 | $6,417 | $180,300 | $35,800 | $144,500 |
| 2016 | $6,379 | $180,300 | $35,800 | $144,500 |
| 2015 | $6,289 | $180,300 | $35,800 | $144,500 |
| 2014 | $6,091 | $180,300 | $35,800 | $144,500 |
Source: Public Records
Map
Nearby Homes
Your Personal Tour Guide
Ask me questions while you tour the home.