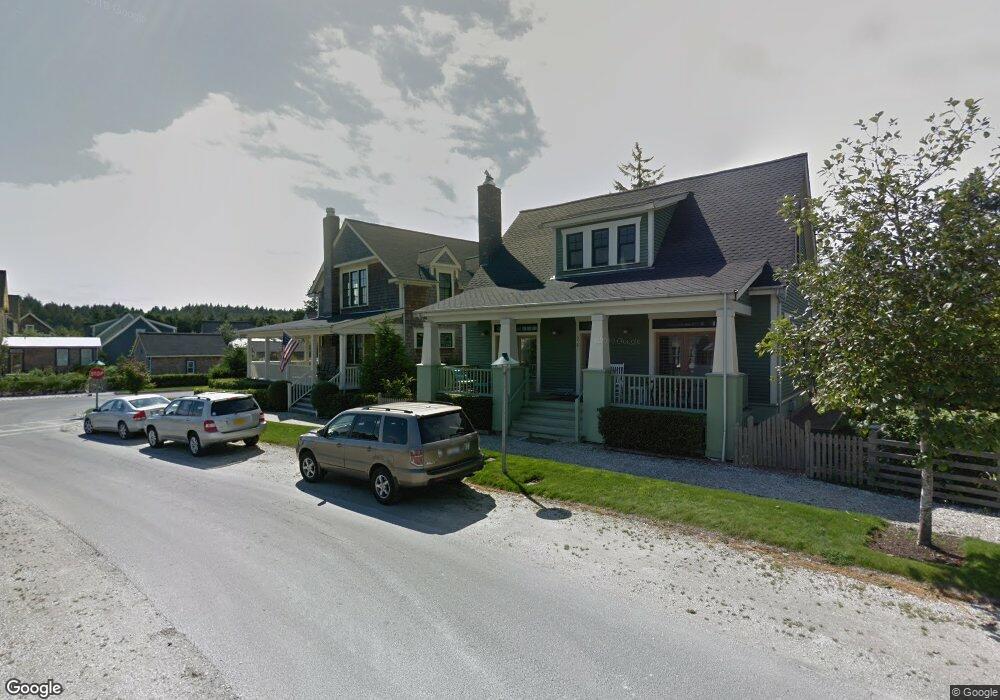
26 Seastar Ln Copalis Crossing, WA 98536
Seabrook NeighborhoodEstimated Value: $1,067,243 - $1,324,000
3
Beds
4
Baths
1,716
Sq Ft
$688/Sq Ft
Est. Value
About This Home
This home is located at 26 Seastar Ln, Copalis Crossing, WA 98536 and is currently estimated at $1,181,061, approximately $688 per square foot. 26 Seastar Ln is a home located in Grays Harbor County with nearby schools including North Beach Junior/Senior High School.
Ownership History
Date
Name
Owned For
Owner Type
Purchase Details
Closed on
Oct 28, 2020
Sold by
Camp Eric and Camp Sarah
Bought by
Suortti Miia and Ernst Ryan
Current Estimated Value
Home Financials for this Owner
Home Financials are based on the most recent Mortgage that was taken out on this home.
Original Mortgage
$510,000
Outstanding Balance
$453,828
Interest Rate
2.8%
Mortgage Type
New Conventional
Estimated Equity
$727,233
Purchase Details
Closed on
Dec 10, 2018
Sold by
Anderson Jeff
Bought by
Camp Eric and Camp Sarah
Home Financials for this Owner
Home Financials are based on the most recent Mortgage that was taken out on this home.
Original Mortgage
$450,375
Interest Rate
4.9%
Mortgage Type
New Conventional
Purchase Details
Closed on
Jun 30, 2015
Sold by
Anderson Patricia
Bought by
Anderson Jeff
Purchase Details
Closed on
Jun 11, 2007
Sold by
Seabrook Construction Company Llc
Bought by
Anderson Jeff and Anderson Patricia
Home Financials for this Owner
Home Financials are based on the most recent Mortgage that was taken out on this home.
Original Mortgage
$500,800
Interest Rate
6.16%
Mortgage Type
New Conventional
Create a Home Valuation Report for This Property
The Home Valuation Report is an in-depth analysis detailing your home's value as well as a comparison with similar homes in the area
Home Values in the Area
Average Home Value in this Area
Purchase History
| Date | Buyer | Sale Price | Title Company |
|---|---|---|---|
| Suortti Miia | $718,000 | Grays Harbor Title | |
| Camp Eric | $600,500 | Grays Horbor Title | |
| Anderson Jeff | -- | None Available | |
| Anderson Jeff | $626,079 | Grays Harbor Title |
Source: Public Records
Mortgage History
| Date | Status | Borrower | Loan Amount |
|---|---|---|---|
| Open | Suortti Miia | $510,000 | |
| Previous Owner | Camp Eric | $450,375 | |
| Previous Owner | Anderson Jeff | $500,800 |
Source: Public Records
Tax History Compared to Growth
Tax History
| Year | Tax Paid | Tax Assessment Tax Assessment Total Assessment is a certain percentage of the fair market value that is determined by local assessors to be the total taxable value of land and additions on the property. | Land | Improvement |
|---|---|---|---|---|
| 2025 | $7,174 | $1,027,622 | $466,956 | $560,666 |
| 2023 | $5,277 | $734,444 | $500,000 | $234,444 |
| 2022 | $6,417 | $718,000 | $140,000 | $578,000 |
| 2021 | $5,951 | $718,000 | $140,000 | $578,000 |
| 2020 | $6,068 | $601,984 | $140,000 | $461,984 |
| 2019 | $6,045 | $601,984 | $140,000 | $461,984 |
| 2018 | $6,438 | $598,884 | $140,000 | $458,884 |
| 2017 | $5,394 | $598,884 | $140,000 | $458,884 |
| 2016 | $5,052 | $520,810 | $140,000 | $380,810 |
| 2014 | -- | $496,910 | $140,000 | $356,910 |
| 2013 | -- | $494,345 | $140,000 | $354,345 |
Source: Public Records
Map
Nearby Homes
- 34 Seastar Ln
- 24 Float Ln
- 18 Primrose Ln
- 91 Compass St
- 228 Meriweather St
- 251 Meriweather St
- 4 Bungalow Loop
- 81 Compass St
- 71 Campfire Ln
- 7 Lupine Ln
- 191 Compass St
- 47 Beach Cabin Ln
- 7 E Myrtle Ln
- 39 Madison Ln
- 38 W Myrtle Ln
- 211 Market St
- 269 Compass St
- 204 Market St Unit A
- 210 Front St
- 216 Front St