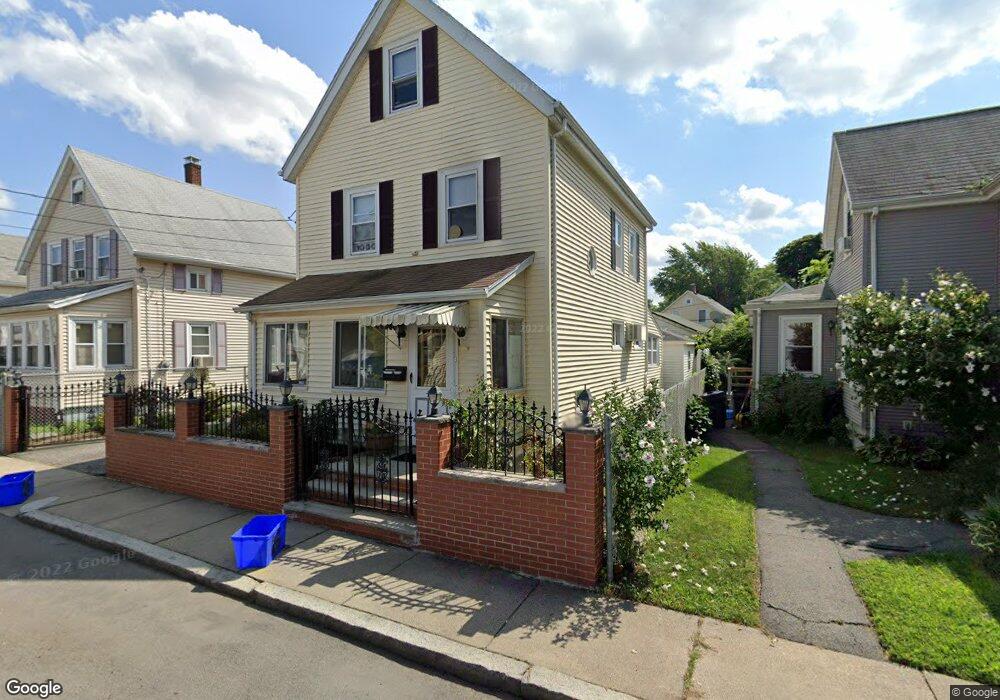
26 Silver St Malden, MA 02148
Linden NeighborhoodEstimated Value: $601,000 - $1,005,000
3
Beds
2
Baths
1,372
Sq Ft
$513/Sq Ft
Est. Value
About This Home
This home is located at 26 Silver St, Malden, MA 02148 and is currently estimated at $704,425, approximately $513 per square foot. 26 Silver St is a home located in Middlesex County with nearby schools including Malden High School and Malden Catholic.
Ownership History
Date
Name
Owned For
Owner Type
Purchase Details
Closed on
Nov 29, 2006
Sold by
Hossain Mohammed M and Hossain Maya
Bought by
Hossain Maya
Current Estimated Value
Purchase Details
Closed on
Sep 7, 1999
Sold by
Chan Cindy Wai-Har
Bought by
Hossain Mohammed M and Hossain Maya
Home Financials for this Owner
Home Financials are based on the most recent Mortgage that was taken out on this home.
Original Mortgage
$149,000
Interest Rate
7.5%
Mortgage Type
Purchase Money Mortgage
Purchase Details
Closed on
Feb 12, 1999
Sold by
Forbes Clyaton J and Forbes Kathleen M
Bought by
Chan Wai Har
Home Financials for this Owner
Home Financials are based on the most recent Mortgage that was taken out on this home.
Original Mortgage
$97,200
Interest Rate
6.78%
Mortgage Type
Purchase Money Mortgage
Create a Home Valuation Report for This Property
The Home Valuation Report is an in-depth analysis detailing your home's value as well as a comparison with similar homes in the area
Home Values in the Area
Average Home Value in this Area
Purchase History
| Date | Buyer | Sale Price | Title Company |
|---|---|---|---|
| Hossain Maya | -- | -- | |
| Hossain Mohammed M | $169,000 | -- | |
| Chan Wai Har | $108,000 | -- |
Source: Public Records
Mortgage History
| Date | Status | Borrower | Loan Amount |
|---|---|---|---|
| Previous Owner | Chan Wai Har | $72,100 | |
| Previous Owner | Chan Wai Har | $149,000 | |
| Previous Owner | Chan Wai Har | $97,200 | |
| Previous Owner | Chan Wai Har | $10,000 |
Source: Public Records
Tax History
| Year | Tax Paid | Tax Assessment Tax Assessment Total Assessment is a certain percentage of the fair market value that is determined by local assessors to be the total taxable value of land and additions on the property. | Land | Improvement |
|---|---|---|---|---|
| 2025 | $63 | $552,700 | $270,100 | $282,600 |
| 2024 | $5,900 | $504,700 | $255,100 | $249,600 |
| 2023 | $5,821 | $477,500 | $232,600 | $244,900 |
| 2022 | $5,533 | $448,000 | $210,100 | $237,900 |
| 2021 | $5,145 | $418,600 | $187,600 | $231,000 |
| 2020 | $5,012 | $396,200 | $181,200 | $215,000 |
| 2019 | $4,824 | $363,500 | $172,600 | $190,900 |
| 2018 | $4,585 | $325,400 | $142,500 | $182,900 |
| 2017 | $4,400 | $310,500 | $136,900 | $173,600 |
| 2016 | $4,274 | $281,900 | $125,700 | $156,200 |
| 2015 | $4,172 | $265,200 | $119,700 | $145,500 |
| 2014 | $4,009 | $249,000 | $108,800 | $140,200 |
Source: Public Records
Map
Nearby Homes
- 44-46 Myrtle St
- 39 Broadway Unit 305
- 557 Salem St Unit 3
- 557 Salem St Unit 4
- 112 Hadley St
- 55 Bowman St
- 1135 Salem St
- 10 Dell St
- 5 Mason St
- 11 Havelock St
- 48 Summit St
- 32 Beach St
- 31 Preston St
- 102 Suffolk St
- 43 Granville Ave
- 70-72 Bainbridge St
- 16 Willard St
- 881 Broadway Unit 44
- 75 Goldie St
- 65 Central Ave
Your Personal Tour Guide
Ask me questions while you tour the home.