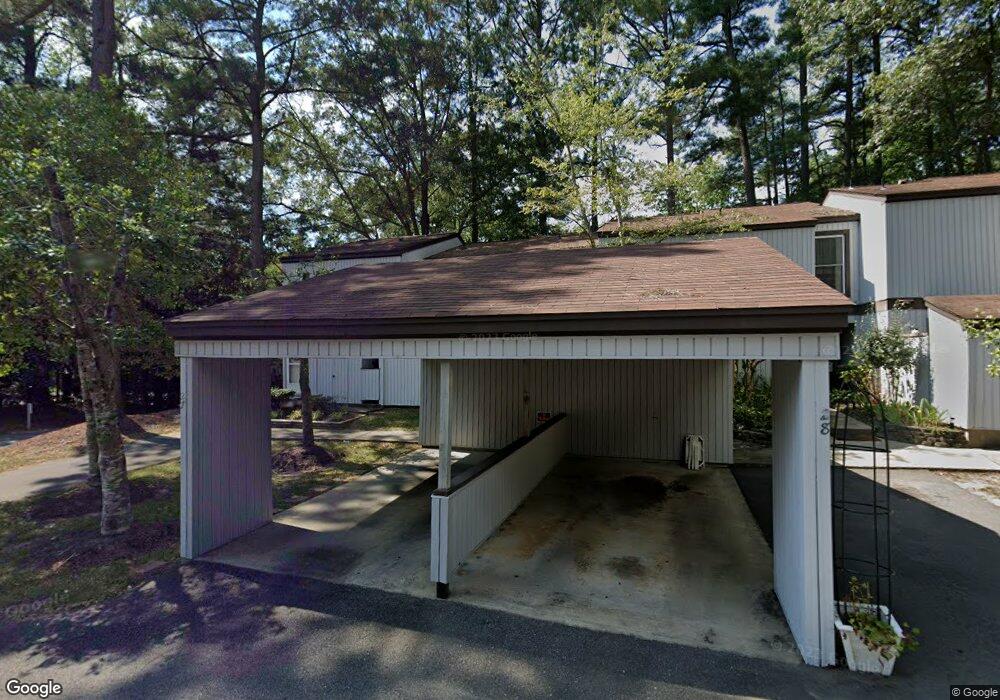
26 Spring E Unit 26 Williamsburg, VA 23188
Centerville NeighborhoodEstimated Value: $206,000 - $226,000
2
Beds
2
Baths
1,090
Sq Ft
$201/Sq Ft
Est. Value
About This Home
This home is located at 26 Spring E Unit 26, Williamsburg, VA 23188 and is currently estimated at $218,956, approximately $200 per square foot. 26 Spring E Unit 26 is a home located in James City County with nearby schools including D.J. Montague Elementary School, Lois Hornsby Middle School, and Lafayette High School.
Ownership History
Date
Name
Owned For
Owner Type
Purchase Details
Closed on
Mar 3, 2025
Sold by
Ruiz Jeffrey
Bought by
Ojr2 Investment Properties Llc
Current Estimated Value
Purchase Details
Closed on
Sep 26, 2023
Sold by
Ojr Investment Properties Llc
Bought by
Ruiz Jeffrey
Purchase Details
Closed on
May 22, 2017
Sold by
Litterer Rebecca C
Bought by
Ruiz Jeffrey and Magno Ruiz Jessica
Home Financials for this Owner
Home Financials are based on the most recent Mortgage that was taken out on this home.
Original Mortgage
$104,000
Interest Rate
4.02%
Mortgage Type
New Conventional
Purchase Details
Closed on
Oct 20, 2005
Sold by
Oliver Stephanie L
Bought by
Speight Rebecca C
Home Financials for this Owner
Home Financials are based on the most recent Mortgage that was taken out on this home.
Original Mortgage
$146,329
Interest Rate
6.07%
Mortgage Type
FHA
Create a Home Valuation Report for This Property
The Home Valuation Report is an in-depth analysis detailing your home's value as well as a comparison with similar homes in the area
Home Values in the Area
Average Home Value in this Area
Purchase History
| Date | Buyer | Sale Price | Title Company |
|---|---|---|---|
| Ojr2 Investment Properties Llc | -- | None Listed On Document | |
| Ruiz Jeffrey | -- | None Listed On Document | |
| Ruiz Jeffrey | $130,000 | None Available | |
| Speight Rebecca C | $148,625 | -- |
Source: Public Records
Mortgage History
| Date | Status | Borrower | Loan Amount |
|---|---|---|---|
| Previous Owner | Ruiz Jeffrey | $104,000 | |
| Previous Owner | Speight Rebecca C | $146,329 |
Source: Public Records
Tax History
| Year | Tax Paid | Tax Assessment Tax Assessment Total Assessment is a certain percentage of the fair market value that is determined by local assessors to be the total taxable value of land and additions on the property. | Land | Improvement |
|---|---|---|---|---|
| 2025 | $1,169 | $161,900 | $42,000 | $119,900 |
| 2024 | $1,169 | $161,900 | $42,000 | $119,900 |
| 2023 | $1,169 | $140,900 | $40,000 | $100,900 |
| 2022 | $1,169 | $140,900 | $40,000 | $100,900 |
| 2021 | $1,061 | $126,300 | $40,000 | $86,300 |
| 2020 | $1,061 | $126,300 | $40,000 | $86,300 |
| 2019 | $1,004 | $119,500 | $38,000 | $81,500 |
| 2018 | $1,004 | $119,500 | $38,000 | $81,500 |
| 2017 | $1,000 | $119,000 | $38,000 | $81,000 |
| 2016 | $1,000 | $119,000 | $38,000 | $81,000 |
| 2015 | -- | $111,300 | $38,000 | $73,300 |
| 2014 | -- | $111,300 | $38,000 | $73,300 |
Source: Public Records
Map
Nearby Homes
- 11 Spring W
- 2 Spring W Unit W
- 2 Spring W
- 12 Autumn E
- 4 Autumn E
- 2 Clarendon Ct
- 533 Spring Trace
- 942 Pheasant Run
- 5302 Sloane Square
- 105 Heron Ct
- 126 Seton Hill Rd
- 304 Hempstead Rd
- 137 Seton Hill Rd
- 178 Devon Rd
- 5361 Ridgewood Hills Dr
- 206 Buford Rd
- 5333 Ridgewood Hills Dr
- 5341 Ridgewood Hills Dr
- 5353 Ridgewood Hills Dr
- 5329 Ridgewood Hills Dr
Your Personal Tour Guide
Ask me questions while you tour the home.