26 Spring St Belfast, ME 04915
Estimated Value: $180,450 - $585,000
Studio
--
Bath
600
Sq Ft
$638/Sq Ft
Est. Value
About This Home
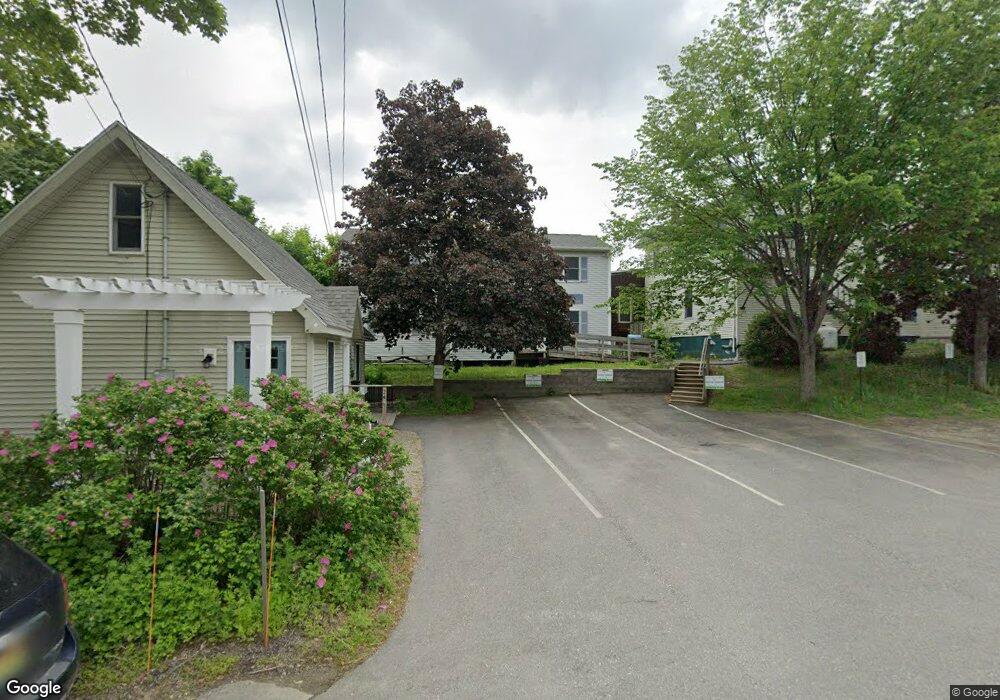
This home is located at 26 Spring St, Belfast, ME 04915 and is currently estimated at $382,725, approximately $637 per square foot. 26 Spring St is a home located in Waldo County with nearby schools including Cornerspring Children's House and The School At Sweetser - Belfast.
Ownership History
Date
Name
Owned For
Owner Type
Purchase Details
Closed on
Apr 5, 2021
Sold by
P & K Ent
Bought by
26 Spring Street Llc
Current Estimated Value
Home Financials for this Owner
Home Financials are based on the most recent Mortgage that was taken out on this home.
Original Mortgage
$168,000
Outstanding Balance
$150,101
Interest Rate
2.9%
Mortgage Type
Purchase Money Mortgage
Estimated Equity
$232,624
Purchase Details
Closed on
Mar 28, 2019
Sold by
P & K Ent
Bought by
P & K Ent
Purchase Details
Closed on
Feb 10, 2012
Sold by
Dalto Philip A and Dalto Mallery A
Bought by
P & K Ent
Create a Home Valuation Report for This Property
The Home Valuation Report is an in-depth analysis detailing your home's value as well as a comparison with similar homes in the area
Home Values in the Area
Average Home Value in this Area
Purchase History
| Date | Buyer | Sale Price | Title Company |
|---|---|---|---|
| 26 Spring Street Llc | -- | None Available | |
| 26 Spring Street Llc | -- | None Available | |
| 26 Spring Street Llc | -- | None Available | |
| P & K Ent | -- | -- | |
| P & K Ent | -- | -- | |
| P & K Ent | -- | -- | |
| Miller Trudy F | -- | -- | |
| Miller Trudy F | -- | -- | |
| P & K Ent | -- | -- | |
| P & K Ent | -- | -- |
Source: Public Records
Mortgage History
| Date | Status | Borrower | Loan Amount |
|---|---|---|---|
| Open | 26 Spring Street Llc | $168,000 | |
| Closed | 26 Spring Street Llc | $168,000 |
Source: Public Records
Tax History
| Year | Tax Paid | Tax Assessment Tax Assessment Total Assessment is a certain percentage of the fair market value that is determined by local assessors to be the total taxable value of land and additions on the property. | Land | Improvement |
|---|---|---|---|---|
| 2025 | $3,394 | $207,700 | $76,300 | $131,400 |
| 2024 | $3,199 | $207,700 | $76,300 | $131,400 |
| 2023 | $2,549 | $126,800 | $72,100 | $54,700 |
| 2022 | $2,714 | $126,800 | $72,100 | $54,700 |
| 2021 | $2,790 | $126,800 | $72,100 | $54,700 |
| 2020 | $2,836 | $121,700 | $67,100 | $54,600 |
| 2019 | $5,512 | $240,700 | $65,000 | $175,700 |
| 2018 | $5,464 | $240,700 | $65,000 | $175,700 |
| 2017 | $5,271 | $240,700 | $65,000 | $175,700 |
| 2016 | $5,533 | $241,600 | $65,000 | $176,600 |
| 2015 | $5,412 | $241,600 | $65,000 | $176,600 |
| 2014 | $5,231 | $241,600 | $65,000 | $176,600 |
| 2013 | $5,025 | $241,600 | $65,000 | $176,600 |
Source: Public Records
Map
Nearby Homes
- 1 Miller St
- 27 Court St Unit 1
- 18 Waldo Ave
- 9 James St
- 183 Main St
- 68 Park St
- 76 Union St
- 41 Grove St
- Lot 5 Waukeag Way
- 2 Swan Lake Ave
- 53 Lincolnville Ave
- 101 Waldo Ave Unit 3-1
- 3 Kerry Gardens Unit 25
- 162 Waldo Ave
- 208 Congress St
- 225 Waldo Ave
- 26 Old Searsport Ave
- 000 Merriam Rd
- 73 Swan Lake Ave
- 65 Patterson Hill Rd
Your Personal Tour Guide
Ask me questions while you tour the home.