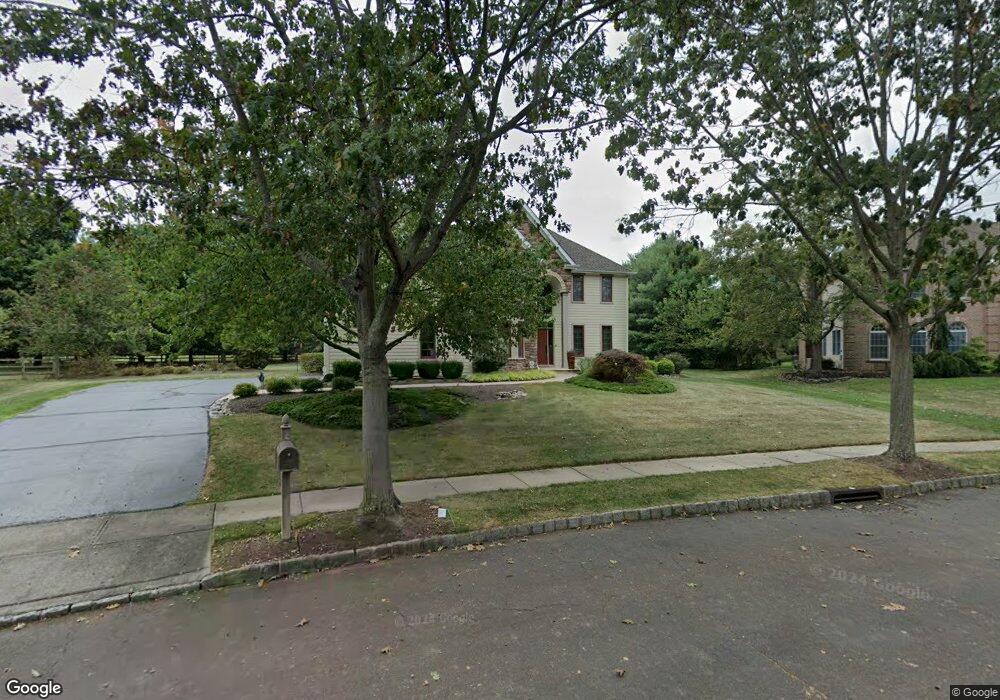
26 Spruce St Princeton Junction, NJ 08550
Estimated Value: $1,117,000 - $1,374,000
--
Bed
--
Bath
3,173
Sq Ft
$398/Sq Ft
Est. Value
About This Home
This home is located at 26 Spruce St, Princeton Junction, NJ 08550 and is currently estimated at $1,263,829, approximately $398 per square foot. 26 Spruce St is a home located in Mercer County with nearby schools including Village Elementary School, Dutch Neck Elementary School, and Community Middle School.
Ownership History
Date
Name
Owned For
Owner Type
Purchase Details
Closed on
Mar 31, 2005
Sold by
Inamdar Madan
Bought by
George Zhou and Cao Yang
Current Estimated Value
Home Financials for this Owner
Home Financials are based on the most recent Mortgage that was taken out on this home.
Original Mortgage
$450,000
Outstanding Balance
$233,574
Interest Rate
5.87%
Estimated Equity
$1,030,255
Purchase Details
Closed on
Feb 27, 1998
Sold by
Lowing James
Bought by
Ruck Franklin and Wolff Ellen
Home Financials for this Owner
Home Financials are based on the most recent Mortgage that was taken out on this home.
Original Mortgage
$50,000
Interest Rate
6.96%
Purchase Details
Closed on
Jan 31, 1994
Sold by
Calton Homes
Bought by
Pe David S and Pe Jesselyn S
Home Financials for this Owner
Home Financials are based on the most recent Mortgage that was taken out on this home.
Original Mortgage
$262,000
Interest Rate
7.08%
Create a Home Valuation Report for This Property
The Home Valuation Report is an in-depth analysis detailing your home's value as well as a comparison with similar homes in the area
Home Values in the Area
Average Home Value in this Area
Purchase History
| Date | Buyer | Sale Price | Title Company |
|---|---|---|---|
| George Zhou | $860,000 | -- | |
| Ruck Franklin | $180,000 | -- | |
| Pe David S | $324,590 | -- |
Source: Public Records
Mortgage History
| Date | Status | Borrower | Loan Amount |
|---|---|---|---|
| Open | George Zhou | $450,000 | |
| Previous Owner | Ruck Franklin | $50,000 | |
| Previous Owner | Pe David S | $262,000 |
Source: Public Records
Tax History Compared to Growth
Tax History
| Year | Tax Paid | Tax Assessment Tax Assessment Total Assessment is a certain percentage of the fair market value that is determined by local assessors to be the total taxable value of land and additions on the property. | Land | Improvement |
|---|---|---|---|---|
| 2025 | $23,000 | $750,400 | $296,500 | $453,900 |
| 2024 | $22,039 | $750,400 | $296,500 | $453,900 |
| 2023 | $22,039 | $750,400 | $296,500 | $453,900 |
| 2022 | $21,612 | $750,400 | $296,500 | $453,900 |
| 2021 | $21,431 | $750,400 | $296,500 | $453,900 |
| 2020 | $21,041 | $750,400 | $296,500 | $453,900 |
| 2019 | $20,801 | $750,400 | $296,500 | $453,900 |
| 2018 | $20,606 | $750,400 | $296,500 | $453,900 |
| 2017 | $20,178 | $750,400 | $296,500 | $453,900 |
| 2016 | $19,743 | $750,400 | $296,500 | $453,900 |
| 2015 | $19,285 | $750,400 | $296,500 | $453,900 |
| 2014 | $19,060 | $750,400 | $296,500 | $453,900 |
Source: Public Records
Map
Nearby Homes