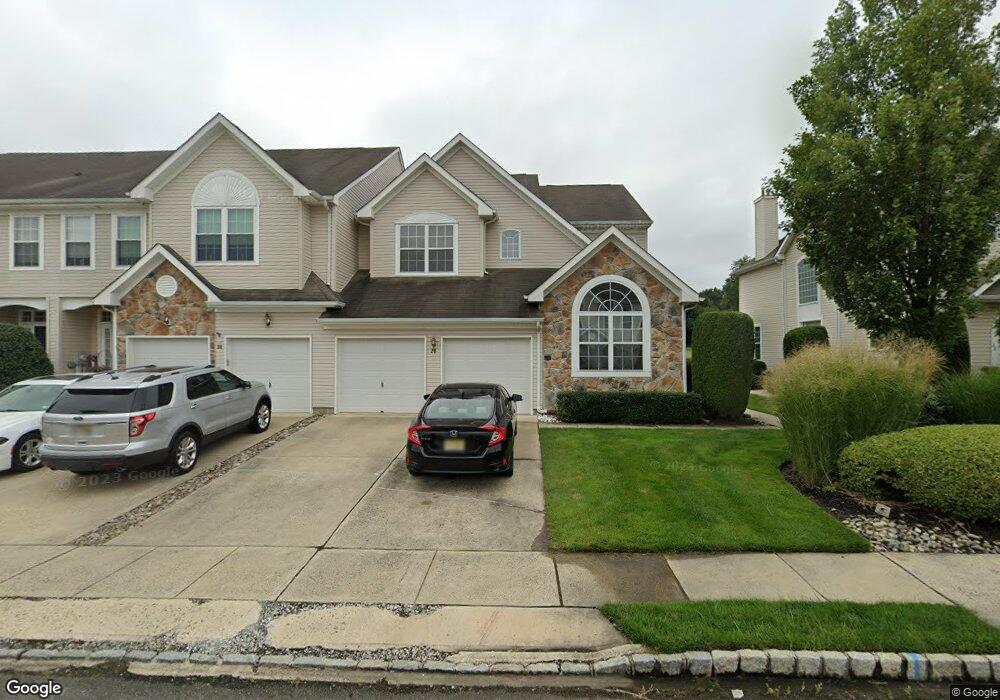
26 Spyglass Ct Mount Holly, NJ 08060
Estimated Value: $481,000 - $504,000
3
Beds
3
Baths
1,838
Sq Ft
$268/Sq Ft
Est. Value
About This Home
This home is located at 26 Spyglass Ct, Mount Holly, NJ 08060 and is currently estimated at $492,235, approximately $267 per square foot. 26 Spyglass Ct is a home located in Burlington County with nearby schools including Holly Hills Elementary School, Westampton Intermediate School, and Rancocas Valley Regional High School.
Ownership History
Date
Name
Owned For
Owner Type
Purchase Details
Closed on
Nov 12, 2010
Sold by
Garnier John W and Garnier Patricia W
Bought by
Kenney Paul W
Current Estimated Value
Home Financials for this Owner
Home Financials are based on the most recent Mortgage that was taken out on this home.
Original Mortgage
$263,200
Interest Rate
4.4%
Mortgage Type
New Conventional
Purchase Details
Closed on
Jul 18, 2007
Sold by
Garnier John W and Garnier Patricia W
Bought by
Garnier John W and Garnier Patricia W
Purchase Details
Closed on
Sep 18, 2002
Sold by
Beazer Homes Corp
Bought by
Garnier John and Garnier Patricia
Home Financials for this Owner
Home Financials are based on the most recent Mortgage that was taken out on this home.
Original Mortgage
$208,500
Interest Rate
6.27%
Create a Home Valuation Report for This Property
The Home Valuation Report is an in-depth analysis detailing your home's value as well as a comparison with similar homes in the area
Home Values in the Area
Average Home Value in this Area
Purchase History
| Date | Buyer | Sale Price | Title Company |
|---|---|---|---|
| Kenney Paul W | $329,000 | Weichert Title Agency | |
| Garnier John W | -- | None Available | |
| Garnier John | $260,870 | Congress Title Corp |
Source: Public Records
Mortgage History
| Date | Status | Borrower | Loan Amount |
|---|---|---|---|
| Previous Owner | Kenney Paul W | $263,200 | |
| Previous Owner | Garnier John | $208,500 |
Source: Public Records
Tax History Compared to Growth
Tax History
| Year | Tax Paid | Tax Assessment Tax Assessment Total Assessment is a certain percentage of the fair market value that is determined by local assessors to be the total taxable value of land and additions on the property. | Land | Improvement |
|---|---|---|---|---|
| 2025 | $7,949 | $283,000 | $52,300 | $230,700 |
| 2024 | $7,649 | $283,000 | $52,300 | $230,700 |
| 2023 | $7,649 | $283,000 | $52,300 | $230,700 |
| 2022 | $7,267 | $283,000 | $52,300 | $230,700 |
| 2021 | $6,999 | $283,000 | $52,300 | $230,700 |
| 2020 | $6,970 | $283,000 | $52,300 | $230,700 |
| 2019 | $6,829 | $283,000 | $52,300 | $230,700 |
| 2018 | $6,741 | $283,000 | $52,300 | $230,700 |
| 2017 | $6,563 | $283,000 | $52,300 | $230,700 |
| 2016 | $6,441 | $283,000 | $52,300 | $230,700 |
| 2015 | $6,317 | $283,000 | $52,300 | $230,700 |
| 2014 | $6,155 | $283,000 | $52,300 | $230,700 |
Source: Public Records
Map
Nearby Homes