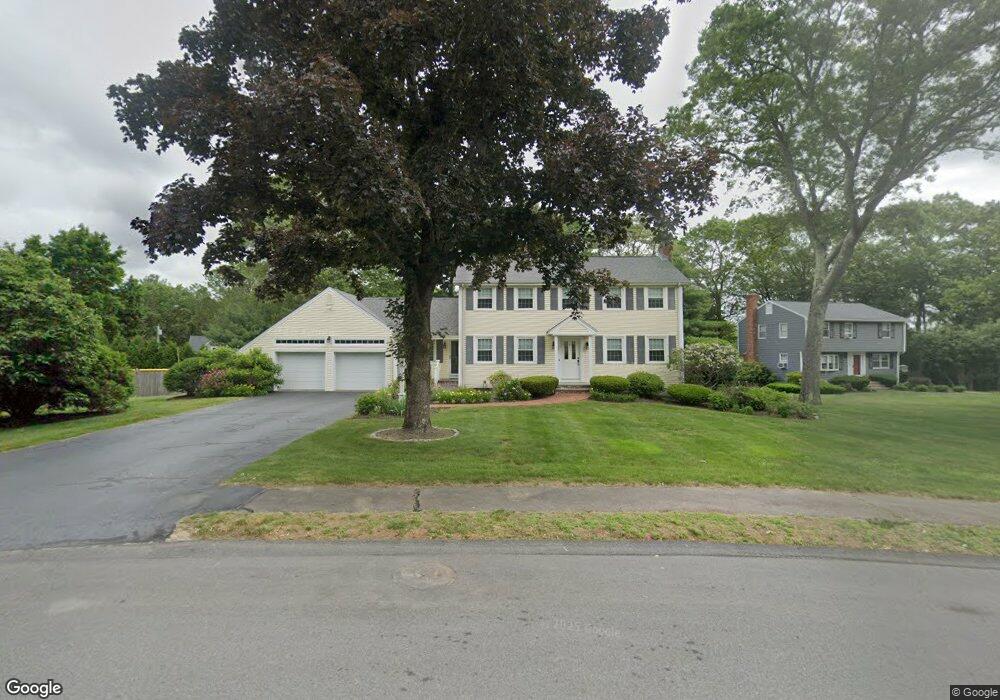
26 Squire Ct East Walpole, MA 02032
Estimated Value: $773,271 - $1,000,000
4
Beds
3
Baths
2,048
Sq Ft
$437/Sq Ft
Est. Value
About This Home
This home is located at 26 Squire Ct, East Walpole, MA 02032 and is currently estimated at $894,568, approximately $436 per square foot. 26 Squire Ct is a home located in Norfolk County with nearby schools including Old Post Road School, Walpole Middle School, and Walpole High School.
Ownership History
Date
Name
Owned For
Owner Type
Purchase Details
Closed on
Apr 7, 2008
Sold by
Betro Lucille E and Betro Maria S
Bought by
Betro Maria S
Current Estimated Value
Home Financials for this Owner
Home Financials are based on the most recent Mortgage that was taken out on this home.
Original Mortgage
$83,000
Outstanding Balance
$52,823
Interest Rate
6.06%
Mortgage Type
Purchase Money Mortgage
Estimated Equity
$841,745
Purchase Details
Closed on
Jul 20, 2006
Sold by
Betro Lucille E
Bought by
Betro Maria S
Create a Home Valuation Report for This Property
The Home Valuation Report is an in-depth analysis detailing your home's value as well as a comparison with similar homes in the area
Home Values in the Area
Average Home Value in this Area
Purchase History
| Date | Buyer | Sale Price | Title Company |
|---|---|---|---|
| Betro Maria S | -- | -- | |
| Betro Maria S | -- | -- |
Source: Public Records
Mortgage History
| Date | Status | Borrower | Loan Amount |
|---|---|---|---|
| Open | Betro Maria S | $83,000 |
Source: Public Records
Tax History Compared to Growth
Tax History
| Year | Tax Paid | Tax Assessment Tax Assessment Total Assessment is a certain percentage of the fair market value that is determined by local assessors to be the total taxable value of land and additions on the property. | Land | Improvement |
|---|---|---|---|---|
| 2025 | $9,249 | $720,900 | $354,200 | $366,700 |
| 2024 | $8,972 | $678,700 | $340,600 | $338,100 |
| 2023 | $8,553 | $615,800 | $296,200 | $319,600 |
| 2022 | $8,035 | $555,700 | $274,300 | $281,400 |
| 2021 | $7,886 | $531,400 | $258,700 | $272,700 |
| 2020 | $7,646 | $510,100 | $244,100 | $266,000 |
| 2019 | $7,370 | $488,100 | $234,700 | $253,400 |
| 2018 | $7,127 | $466,700 | $226,600 | $240,100 |
| 2017 | $6,921 | $451,500 | $217,900 | $233,600 |
| 2016 | $6,725 | $432,200 | $209,500 | $222,700 |
| 2015 | $6,662 | $424,300 | $208,000 | $216,300 |
| 2014 | $6,389 | $405,400 | $208,000 | $197,400 |
Source: Public Records
Map
Nearby Homes
- 270 Moosehill Rd
- 11 Park Ln
- 486 Washington St
- Unit 11 Powder House Ln Unit 11
- 8 Powder House Ln Unit 2
- Unit 12 Powder House Ln Unit 12
- Unit 3 Powder House Ln Unit 3
- 363 - 367 Washington St
- 2 Alexandra Way
- 7 Washington Green
- 1 Palace Ct
- 5 Powder House Ln Unit 14
- 52 Baker St
- 0 Charlotte Rd
- 93 Brewster Dr
- 256 Norwood St
- 8 Rainbow Pond Dr Unit 8
- 22 Coolidge Rd
- 4403 Pennington Dr Unit 4403
- 20 Rockhill St