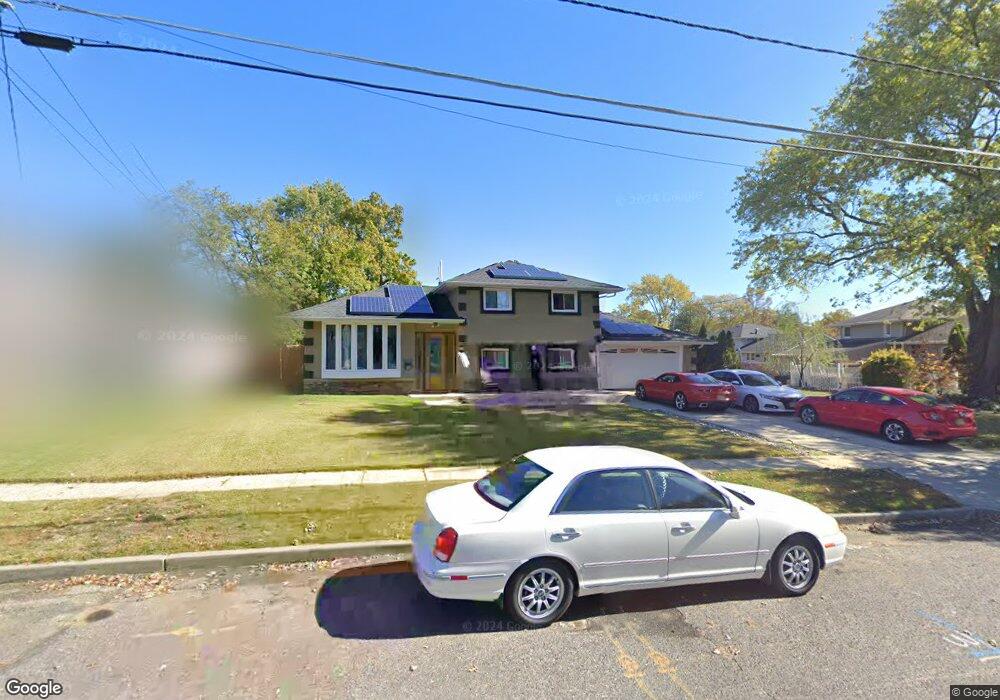
26 Stephen Dr Glendora, NJ 08029
Estimated Value: $360,000 - $377,000
3
Beds
2
Baths
1,509
Sq Ft
$244/Sq Ft
Est. Value
About This Home
This home is located at 26 Stephen Dr, Glendora, NJ 08029 and is currently estimated at $368,661, approximately $244 per square foot. 26 Stephen Dr is a home located in Camden County with nearby schools including Glen Landing Middle School, Triton High School, and St. Teresa Regional School.
Ownership History
Date
Name
Owned For
Owner Type
Purchase Details
Closed on
Aug 8, 2008
Sold by
Suppa Angelino
Bought by
Monteferrante Synthia
Current Estimated Value
Home Financials for this Owner
Home Financials are based on the most recent Mortgage that was taken out on this home.
Original Mortgage
$192,750
Outstanding Balance
$128,722
Interest Rate
6.69%
Mortgage Type
FHA
Estimated Equity
$239,939
Purchase Details
Closed on
Oct 15, 1997
Sold by
Lazarevich Goran
Bought by
Suppa John and Suppa Angeline
Home Financials for this Owner
Home Financials are based on the most recent Mortgage that was taken out on this home.
Original Mortgage
$75,000
Interest Rate
7.23%
Purchase Details
Closed on
Aug 31, 1994
Sold by
Cusato James
Bought by
Lazarevich Goran and Lazarevich Ubavka
Home Financials for this Owner
Home Financials are based on the most recent Mortgage that was taken out on this home.
Original Mortgage
$106,000
Interest Rate
8.54%
Create a Home Valuation Report for This Property
The Home Valuation Report is an in-depth analysis detailing your home's value as well as a comparison with similar homes in the area
Home Values in the Area
Average Home Value in this Area
Purchase History
| Date | Buyer | Sale Price | Title Company |
|---|---|---|---|
| Monteferrante Synthia | $195,000 | -- | |
| Suppa John | $103,419 | -- | |
| Lazarevich Goran | $114,000 | -- |
Source: Public Records
Mortgage History
| Date | Status | Borrower | Loan Amount |
|---|---|---|---|
| Open | Monteferrante Synthia | $192,750 | |
| Previous Owner | Suppa John | $75,000 | |
| Previous Owner | Lazarevich Goran | $106,000 |
Source: Public Records
Tax History Compared to Growth
Tax History
| Year | Tax Paid | Tax Assessment Tax Assessment Total Assessment is a certain percentage of the fair market value that is determined by local assessors to be the total taxable value of land and additions on the property. | Land | Improvement |
|---|---|---|---|---|
| 2025 | $9,259 | $219,100 | $60,200 | $158,900 |
| 2024 | $8,950 | $219,100 | $60,200 | $158,900 |
| 2023 | $8,950 | $219,100 | $60,200 | $158,900 |
| 2022 | $8,902 | $219,100 | $60,200 | $158,900 |
| 2021 | $8,190 | $219,100 | $60,200 | $158,900 |
| 2020 | $8,722 | $219,100 | $60,200 | $158,900 |
| 2019 | $8,530 | $219,100 | $60,200 | $158,900 |
| 2018 | $8,492 | $219,100 | $60,200 | $158,900 |
| 2017 | $9,895 | $219,100 | $60,200 | $158,900 |
| 2016 | $8,037 | $219,100 | $60,200 | $158,900 |
| 2015 | $7,460 | $219,100 | $60,200 | $158,900 |
| 2014 | $7,417 | $219,100 | $60,200 | $158,900 |
Source: Public Records
Map
Nearby Homes
- 711 George Ln
- 27 Lillian Place
- 13 Albert Rd
- 2400 Hartford Dr
- 32 Reagan Rd
- 30 Reagan Rd
- 24 Reagan Rd
- 26 Reagan Rd
- DELMAR Plan at Ashbrook Landing
- 22 Reagan Rd
- 28 Reagan Rd
- 327 E Evesham Rd
- 43 Whaler Dr
- 39 Whaler Dr
- 41 Whaler Dr
- 37 Whaler Dr
- 45 Whaler Dr
- 32 Reagan Dr
- 30 Reagan Dr
- 230 E Evesham Rd Unit B-1