Estimated Value: $1,327,843 - $1,661,000
5
Beds
4
Baths
2,840
Sq Ft
$528/Sq Ft
Est. Value
About This Home
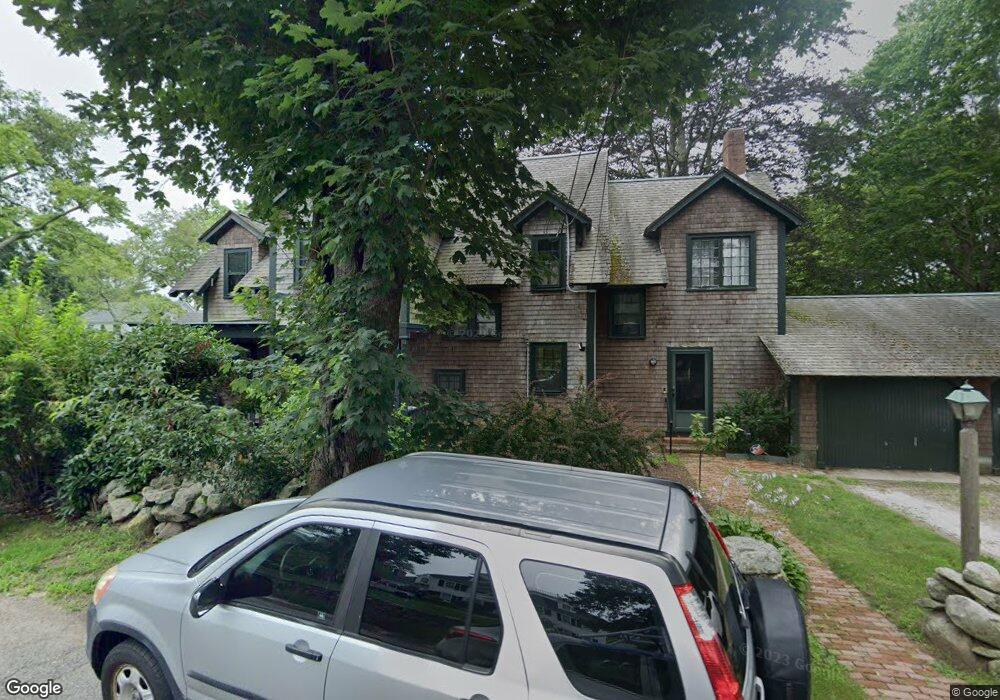
This home is located at 26 Summer St, South Dartmouth, MA 02748 and is currently estimated at $1,500,711, approximately $528 per square foot. 26 Summer St is a home located in Bristol County with nearby schools including Dartmouth High School and St. Teresa of Calcutta School.
Ownership History
Date
Name
Owned For
Owner Type
Purchase Details
Closed on
Sep 24, 2012
Sold by
Nelson Carol A
Bought by
Carol Ann Nelson Ret
Current Estimated Value
Purchase Details
Closed on
Jan 14, 1998
Sold by
Dias Robert A and Dias Joyce A
Bought by
Read Laurance A and Nelson Carol Ann
Home Financials for this Owner
Home Financials are based on the most recent Mortgage that was taken out on this home.
Original Mortgage
$340,000
Interest Rate
7.08%
Mortgage Type
Purchase Money Mortgage
Create a Home Valuation Report for This Property
The Home Valuation Report is an in-depth analysis detailing your home's value as well as a comparison with similar homes in the area
Home Values in the Area
Average Home Value in this Area
Purchase History
| Date | Buyer | Sale Price | Title Company |
|---|---|---|---|
| Carol Ann Nelson Ret | -- | -- | |
| Read Laurance A | $400,000 | -- |
Source: Public Records
Mortgage History
| Date | Status | Borrower | Loan Amount |
|---|---|---|---|
| Previous Owner | Read Laurance A | $256,000 | |
| Previous Owner | Read Laurance A | $262,000 | |
| Previous Owner | Read Laurance A | $340,000 |
Source: Public Records
Tax History Compared to Growth
Tax History
| Year | Tax Paid | Tax Assessment Tax Assessment Total Assessment is a certain percentage of the fair market value that is determined by local assessors to be the total taxable value of land and additions on the property. | Land | Improvement |
|---|---|---|---|---|
| 2025 | $9,600 | $1,115,000 | $494,500 | $620,500 |
| 2024 | $8,985 | $1,033,900 | $480,700 | $553,200 |
| 2023 | $8,563 | $933,800 | $423,000 | $510,800 |
| 2022 | $8,369 | $845,400 | $423,000 | $422,400 |
| 2021 | $8,546 | $824,900 | $420,000 | $404,900 |
| 2020 | $8,518 | $820,600 | $433,300 | $387,300 |
| 2019 | $8,421 | $809,700 | $444,000 | $365,700 |
| 2018 | $8,784 | $799,900 | $453,300 | $346,600 |
| 2017 | $7,811 | $779,500 | $427,800 | $351,700 |
| 2016 | $7,175 | $706,200 | $392,600 | $313,600 |
| 2015 | $6,648 | $655,600 | $337,500 | $318,100 |
| 2014 | $6,449 | $631,600 | $320,200 | $311,400 |
Source: Public Records
Map
Nearby Homes
- 40 School St
- 23 High St
- 0 Stoneledge Rd
- 00 Prospect St
- 2 Spinnaker Ln
- 48 Wilson St
- 76 Shipyard Ln
- 179 Rockland St
- 21 Avis St
- 59 Hidden Bay Dr
- 212 Rockland St
- 0 East Ave Unit 73382206
- 738 Smith Neck Rd
- 15 Puritan St
- 18 Saint John St
- 75 Country Way Unit 75
- 1 Walter St
- 3 Mishawum Dr
- 5 Samosett Dr
- 161 Portland St