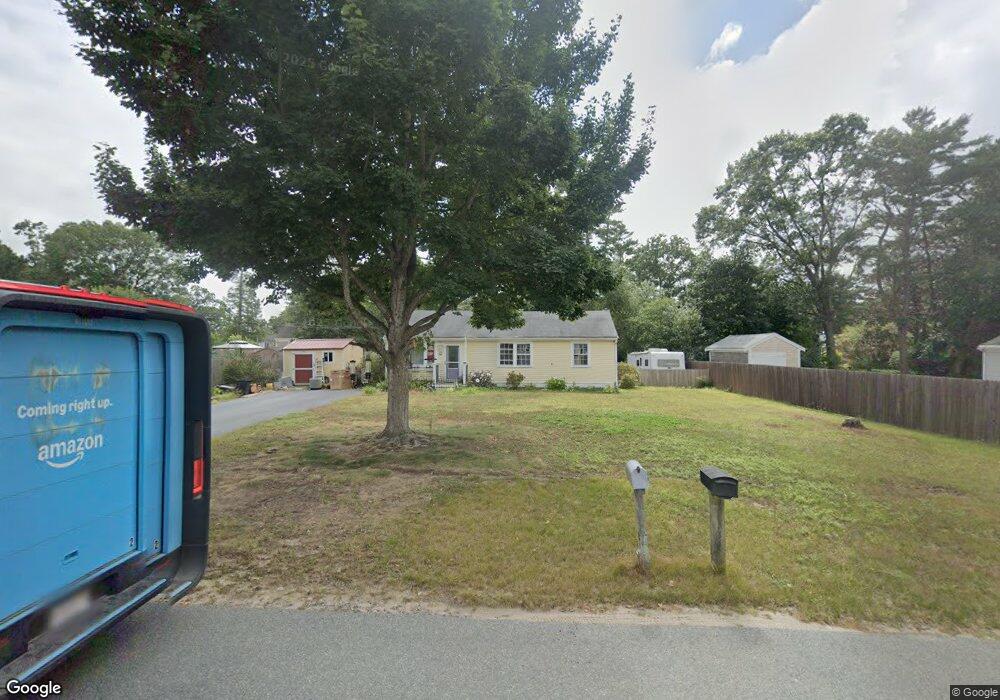
26 Summer St Wareham, MA 02571
Estimated Value: $435,000 - $489,000
3
Beds
2
Baths
974
Sq Ft
$472/Sq Ft
Est. Value
About This Home
This home is located at 26 Summer St, Wareham, MA 02571 and is currently estimated at $460,156, approximately $472 per square foot. 26 Summer St is a home located in Plymouth County.
Ownership History
Date
Name
Owned For
Owner Type
Purchase Details
Closed on
Oct 3, 2007
Sold by
Higgins Angela and Higgins Richard
Bought by
Higgins Richard
Current Estimated Value
Purchase Details
Closed on
May 24, 2002
Sold by
Soares Victor C
Bought by
Higgins Angela and Higgins Richard
Home Financials for this Owner
Home Financials are based on the most recent Mortgage that was taken out on this home.
Original Mortgage
$166,410
Interest Rate
7.01%
Mortgage Type
Purchase Money Mortgage
Create a Home Valuation Report for This Property
The Home Valuation Report is an in-depth analysis detailing your home's value as well as a comparison with similar homes in the area
Purchase History
| Date | Buyer | Sale Price | Title Company |
|---|---|---|---|
| Higgins Richard | -- | -- | |
| Higgins Richard | -- | -- | |
| Higgins Angela | $184,900 | -- | |
| Higgins Angela | $184,900 | -- |
Source: Public Records
Mortgage History
| Date | Status | Borrower | Loan Amount |
|---|---|---|---|
| Previous Owner | Higgins Angela | $216,000 | |
| Previous Owner | Higgins Angela | $166,410 |
Source: Public Records
Tax History
| Year | Tax Paid | Tax Assessment Tax Assessment Total Assessment is a certain percentage of the fair market value that is determined by local assessors to be the total taxable value of land and additions on the property. | Land | Improvement |
|---|---|---|---|---|
| 2025 | $3,908 | $375,000 | $121,400 | $253,600 |
| 2024 | $4,015 | $357,500 | $95,100 | $262,400 |
| 2023 | $3,848 | $319,900 | $86,400 | $233,500 |
| 2022 | $3,609 | $273,800 | $86,400 | $187,400 |
| 2021 | $3,566 | $265,100 | $86,400 | $178,700 |
| 2020 | $3,324 | $250,700 | $86,400 | $164,300 |
| 2019 | $3,221 | $242,400 | $83,800 | $158,600 |
| 2018 | $3,031 | $222,400 | $83,800 | $138,600 |
| 2017 | $2,800 | $208,200 | $83,800 | $124,400 |
| 2016 | $2,559 | $189,100 | $81,800 | $107,300 |
| 2015 | $2,472 | $189,100 | $81,800 | $107,300 |
| 2014 | $2,325 | $180,900 | $81,800 | $99,100 |
Source: Public Records
Map
Nearby Homes
- 2711 Cranberry Hwy
- 2697 Cranberry Hwy Unit 23
- 2645 Cranberry Hwy Unit A
- 103 Kimberly Ct
- 156 Sandwich Rd
- 2783 Cranberry Hwy
- 0 Charge Pond Rd
- 110 Mayflower Ridge Dr
- 25 Linwood Ave
- 55 Minot Ave Unit 55
- 10 Oak St
- 437 Main St
- 2838 Cranberry Hwy
- 102 Maple Springs Rd
- 91 Agawam Lake Shore Dr
- 124 Minot Ave Unit 1
- 9 Old Glen Charlie Rd
- 7 Knowles Ave
- 223 Charge Pond Rd
- 106 Circuit Ave
Your Personal Tour Guide
Ask me questions while you tour the home.