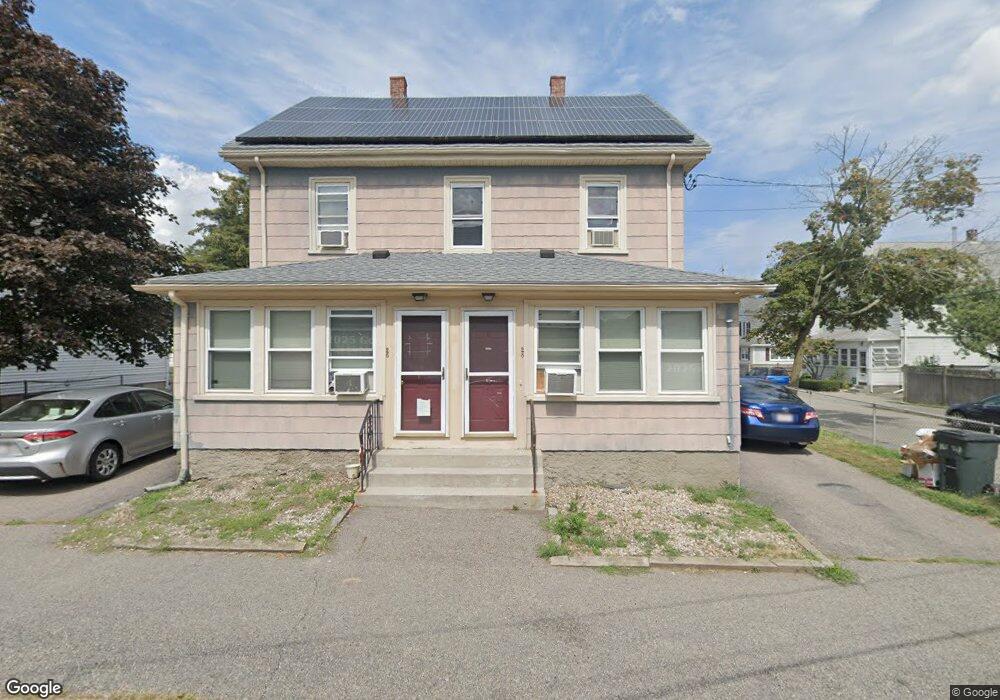
26 Taber St Unit 26 Quincy, MA 02169
South Quincy NeighborhoodEstimated Value: $970,000 - $1,177,000
4
Beds
2
Baths
2,000
Sq Ft
$536/Sq Ft
Est. Value
About This Home
This home is located at 26 Taber St Unit 26, Quincy, MA 02169 and is currently estimated at $1,071,549, approximately $535 per square foot. 26 Taber St Unit 26 is a home located in Norfolk County with nearby schools including South West Middle School, Lincoln-Hancock Community School, and Quincy High School.
Ownership History
Date
Name
Owned For
Owner Type
Purchase Details
Closed on
Sep 6, 2018
Sold by
Caledonia Lt and Shaw
Bought by
Umapathy Vadivel and Umapathy Purushothaman S
Current Estimated Value
Home Financials for this Owner
Home Financials are based on the most recent Mortgage that was taken out on this home.
Original Mortgage
$646,000
Outstanding Balance
$553,943
Interest Rate
4.5%
Mortgage Type
Purchase Money Mortgage
Estimated Equity
$517,606
Create a Home Valuation Report for This Property
The Home Valuation Report is an in-depth analysis detailing your home's value as well as a comparison with similar homes in the area
Home Values in the Area
Average Home Value in this Area
Purchase History
We collect this data history from publicly available records. To have your information removed, we recommend requesting removal directly through your county’s website.
| Date | Buyer | Sale Price | Title Company |
|---|---|---|---|
| Umapathy Vadivel | $760,000 | -- |
Source: Public Records
Mortgage History
We collect this data history from publicly available records. To have your information removed, we recommend requesting removal directly through your county’s website.
| Date | Status | Borrower | Loan Amount |
|---|---|---|---|
| Open | Umapathy Vadivel | $646,000 |
Source: Public Records
Tax History
| Year | Tax Paid | Tax Assessment Tax Assessment Total Assessment is a certain percentage of the fair market value that is determined by local assessors to be the total taxable value of land and additions on the property. | Land | Improvement |
|---|---|---|---|---|
| 2025 | $11,325 | $982,200 | $289,500 | $692,700 |
| 2024 | $10,694 | $948,900 | $275,800 | $673,100 |
| 2023 | $10,257 | $921,600 | $250,700 | $670,900 |
| 2022 | $10,575 | $882,700 | $208,900 | $673,800 |
| 2021 | $9,771 | $804,900 | $208,900 | $596,000 |
| 2020 | $9,864 | $793,600 | $208,900 | $584,700 |
| 2019 | $8,617 | $686,600 | $197,100 | $489,500 |
| 2018 | $8,607 | $645,200 | $182,500 | $462,700 |
| 2017 | $8,903 | $628,300 | $173,800 | $454,500 |
| 2016 | $7,622 | $530,800 | $151,100 | $379,700 |
| 2015 | $7,447 | $510,100 | $151,100 | $359,000 |
| 2014 | $6,286 | $423,000 | $151,100 | $271,900 |
Source: Public Records
Map
Nearby Homes
- 21 Totman St Unit 205
- 21 Totman St Unit 302
- 21 Totman St Unit 403
- 21 Totman St Unit 301
- 117 Quincy St Unit 2
- 8 Jackson St Unit C4
- 8 Jackson St Unit B4
- 91 Garfield St
- 18 N Payne St
- 31 Station St
- 9 Independence Ave Unit 102
- 104 Holmes St
- 199 Hawthorn Rd
- 39-47 Water St
- 156 West St
- 211 West St Unit 11B
- 211 West St Unit 4B
- 211 West St Unit 12B
- 233 West St
- 211 Copeland St
- 26 Taber St
- 26 Taber St Unit 1
- 28 Taber St Unit 1
- 20 Taber St
- 17 Rodman St
- 29 Taber St Unit 1
- 34 Taber St
- 36 Taber St Unit 36
- 36 Taber St
- 36 Taber St Unit 1
- 18 Taber St
- 20 Rodman St
- 72 Intervale St
- 27 Taber St
- 13 Rodman St
- 16 Rodman St
- 35 Taber St
- 90 Intervale St
- 68 Intervale St
- 70 Intervale St Unit 1
Your Personal Tour Guide
Ask me questions while you tour the home.