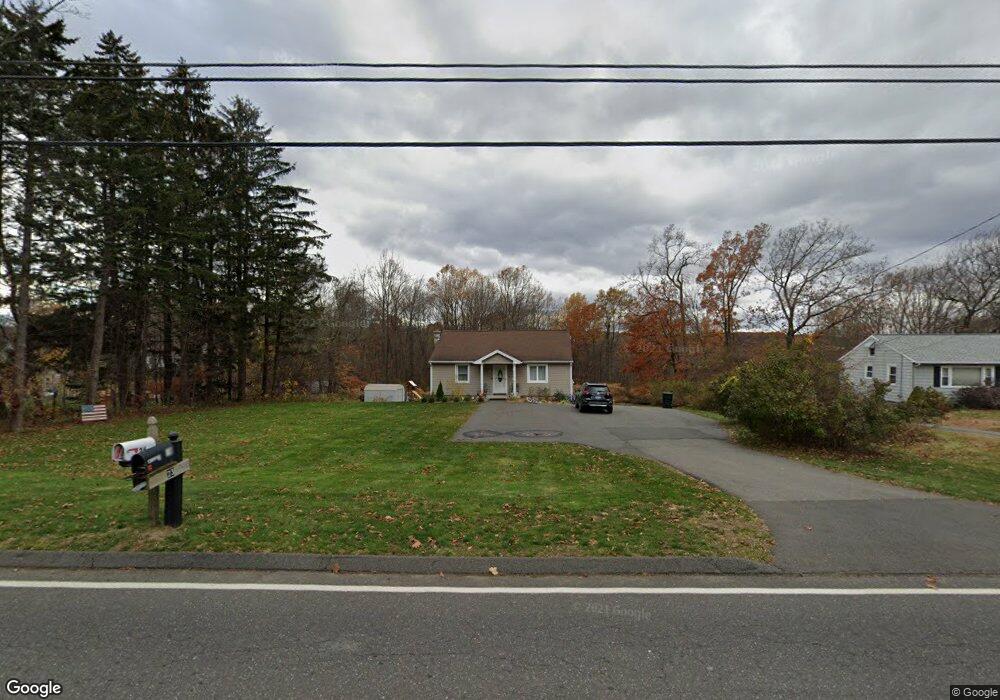
26 Talmadge Hill Rd Prospect, CT 06712
Estimated Value: $344,000 - $418,000
3
Beds
1
Bath
1,088
Sq Ft
$343/Sq Ft
Est. Value
About This Home
This home is located at 26 Talmadge Hill Rd, Prospect, CT 06712 and is currently estimated at $373,010, approximately $342 per square foot. 26 Talmadge Hill Rd is a home located in New Haven County with nearby schools including Prospect Elementary School, Long River Middle School, and Woodland Regional High School.
Ownership History
Date
Name
Owned For
Owner Type
Purchase Details
Closed on
Apr 22, 2016
Sold by
Bayarinas Jance M
Bought by
Bayarinas Janice M and Pilkington Brian J
Current Estimated Value
Purchase Details
Closed on
Sep 25, 2014
Sold by
Ganucheau Edmond F
Bought by
Bayarinas Janice M
Home Financials for this Owner
Home Financials are based on the most recent Mortgage that was taken out on this home.
Original Mortgage
$166,920
Interest Rate
4.12%
Mortgage Type
FHA
Purchase Details
Closed on
Jun 8, 2011
Sold by
Desarbo Kristin B
Bought by
Ganucheau Edmond F
Purchase Details
Closed on
Sep 20, 2007
Sold by
Citimortgage Inc
Bought by
Ganucheau Edmond F and Desarbo Kristin B
Home Financials for this Owner
Home Financials are based on the most recent Mortgage that was taken out on this home.
Original Mortgage
$157,950
Interest Rate
6.63%
Purchase Details
Closed on
Nov 29, 2005
Sold by
Byrnes George J
Bought by
Byrnes Jennifer M
Create a Home Valuation Report for This Property
The Home Valuation Report is an in-depth analysis detailing your home's value as well as a comparison with similar homes in the area
Home Values in the Area
Average Home Value in this Area
Purchase History
| Date | Buyer | Sale Price | Title Company |
|---|---|---|---|
| Bayarinas Janice M | -- | -- | |
| Bayarinas Janice M | $170,000 | -- | |
| Ganucheau Edmond F | -- | -- | |
| Ganucheau Edmond F | $175,500 | -- | |
| Byrnes Jennifer M | $205,000 | -- |
Source: Public Records
Mortgage History
| Date | Status | Borrower | Loan Amount |
|---|---|---|---|
| Previous Owner | Byrnes Jennifer M | $166,920 | |
| Previous Owner | Byrnes Jennifer M | $157,950 |
Source: Public Records
Tax History Compared to Growth
Tax History
| Year | Tax Paid | Tax Assessment Tax Assessment Total Assessment is a certain percentage of the fair market value that is determined by local assessors to be the total taxable value of land and additions on the property. | Land | Improvement |
|---|---|---|---|---|
| 2025 | $5,533 | $216,370 | $100,450 | $115,920 |
| 2024 | $5,296 | $164,780 | $100,410 | $64,370 |
| 2023 | $5,260 | $164,780 | $100,410 | $64,370 |
| 2022 | $5,265 | $164,780 | $100,410 | $64,370 |
| 2021 | $5,322 | $164,780 | $100,410 | $64,370 |
| 2020 | $5,235 | $165,660 | $108,440 | $57,220 |
| 2019 | $5,127 | $165,660 | $108,440 | $57,220 |
| 2018 | $5,135 | $165,660 | $108,440 | $57,220 |
| 2017 | $5,177 | $165,660 | $108,440 | $57,220 |
| 2016 | $4,955 | $165,660 | $108,440 | $57,220 |
| 2015 | $4,870 | $166,600 | $108,430 | $58,170 |
| 2014 | $4,828 | $166,600 | $108,430 | $58,170 |
Source: Public Records
Map
Nearby Homes
- 23 Nancy Mae Ave
- 44 Cheshire Rd
- 9 Ridgewood Club Rd
- 7 Ridgewood Club Rd
- 20 New Haven Rd
- 9 Melissa Ln
- 27 Holley Ln
- 6 Holley Ln
- 46 Barbara Ave
- 39a Waterbury Rd
- 20 Hydelor Ave
- 14 Farmwood Dr
- 16 Plank Rd
- 85 Inverness Ct
- 79 Summit Rd
- 43 Straitsville Rd
- 9 Corrine Dr
- 66 Union City Rd
- 40 Whispering Hollow Ct
- 17A Morris Rd
- 24 Talmadge Hill Rd
- 30 Talmadge Hill Rd
- 20 Talmadge Hill Rd
- 32 Talmadge Hill Rd
- 22 Talmadge Hill Rd
- 27 Talmadge Hill Rd
- 21 Talmadge Hill Rd
- 19 Talmadge Hill Rd
- 34 Talmadge Hill Rd
- 18 Talmadge Hill Rd
- 25 Talmadge Hill Rd
- 31 Talmadge Hill Rd
- 17 Talmadge Hill Rd
- 36R Talmadge Hill Rd
- 36 Talmadge Hill Rd
- 16 Talmadge Hill Rd
- 14 Talmadge Hill Rd
- 15 Talmadge Hill Rd
- 33 Talmadge Hill Rd
- 38C Talmadge Hill Rd