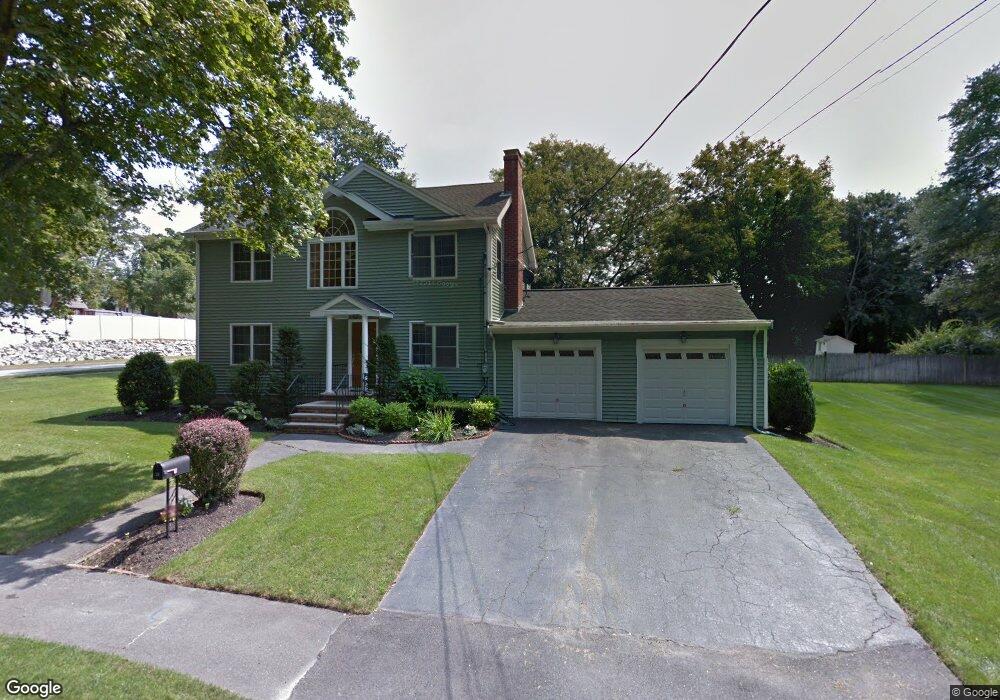
26 Thomas Rd Lynnfield, MA 01940
Estimated Value: $1,044,000 - $1,318,000
3
Beds
2
Baths
1,843
Sq Ft
$620/Sq Ft
Est. Value
About This Home
This home is located at 26 Thomas Rd, Lynnfield, MA 01940 and is currently estimated at $1,143,091, approximately $620 per square foot. 26 Thomas Rd is a home located in Essex County with nearby schools including Pickering Middle School, Lynnfield High School, and Odyssey Day School.
Ownership History
Date
Name
Owned For
Owner Type
Purchase Details
Closed on
Jul 8, 2008
Sold by
Crompton Donald S and Crompton Patricia A
Bought by
Kotsaninis Ilias and Kotsaninis Leonora
Current Estimated Value
Purchase Details
Closed on
Nov 30, 2000
Sold by
Eramo Vincent and Eramo Cynthia
Bought by
Crompton Donald S and Crompton Patricia A
Create a Home Valuation Report for This Property
The Home Valuation Report is an in-depth analysis detailing your home's value as well as a comparison with similar homes in the area
Home Values in the Area
Average Home Value in this Area
Purchase History
| Date | Buyer | Sale Price | Title Company |
|---|---|---|---|
| Kotsaninis Ilias | $452,000 | -- | |
| Crompton Donald S | $320,000 | -- |
Source: Public Records
Mortgage History
| Date | Status | Borrower | Loan Amount |
|---|---|---|---|
| Open | Crompton Donald S | $320,000 | |
| Closed | Crompton Donald S | $329,000 |
Source: Public Records
Tax History Compared to Growth
Tax History
| Year | Tax Paid | Tax Assessment Tax Assessment Total Assessment is a certain percentage of the fair market value that is determined by local assessors to be the total taxable value of land and additions on the property. | Land | Improvement |
|---|---|---|---|---|
| 2025 | $10,271 | $972,600 | $564,200 | $408,400 |
| 2024 | $9,829 | $935,200 | $542,500 | $392,700 |
| 2023 | $9,723 | $860,400 | $514,500 | $345,900 |
| 2022 | $9,187 | $766,200 | $472,500 | $293,700 |
| 2021 | $8,793 | $662,600 | $385,000 | $277,600 |
| 2020 | $8,664 | $622,400 | $344,800 | $277,600 |
| 2019 | $8,658 | $622,400 | $344,800 | $277,600 |
| 2018 | $8,961 | $651,200 | $344,800 | $306,400 |
| 2017 | $8,804 | $638,900 | $332,500 | $306,400 |
| 2016 | $8,265 | $570,000 | $285,300 | $284,700 |
| 2015 | $8,243 | $568,900 | $284,200 | $284,700 |
Source: Public Records
Map
Nearby Homes