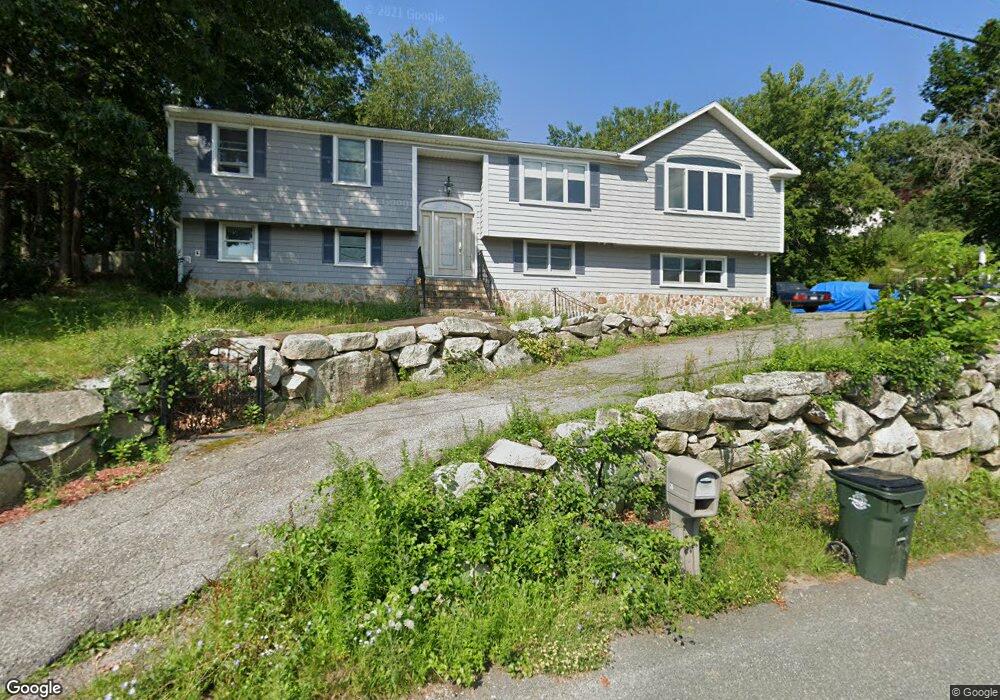
26 Thornhill Rd Fall River, MA 02723
Bank Street NeighborhoodEstimated Value: $509,000 - $599,000
4
Beds
3
Baths
3,144
Sq Ft
$176/Sq Ft
Est. Value
About This Home
This home is located at 26 Thornhill Rd, Fall River, MA 02723 and is currently estimated at $552,834, approximately $175 per square foot. 26 Thornhill Rd is a home located in Bristol County with nearby schools including Mary Fonseca Elementary School, Talbot Innovation School, and B M C Durfee High School.
Ownership History
Date
Name
Owned For
Owner Type
Purchase Details
Closed on
Apr 1, 2022
Sold by
Souza Almerinda J
Bought by
Rodrigues Victor and Rodrigues Jessica
Current Estimated Value
Home Financials for this Owner
Home Financials are based on the most recent Mortgage that was taken out on this home.
Original Mortgage
$80,000
Outstanding Balance
$74,612
Interest Rate
3.92%
Mortgage Type
Purchase Money Mortgage
Estimated Equity
$478,222
Purchase Details
Closed on
Jun 5, 1991
Sold by
L & K Construction Co
Bought by
Souza David G and Souza Almerinda
Home Financials for this Owner
Home Financials are based on the most recent Mortgage that was taken out on this home.
Original Mortgage
$108,000
Interest Rate
9.42%
Mortgage Type
Purchase Money Mortgage
Create a Home Valuation Report for This Property
The Home Valuation Report is an in-depth analysis detailing your home's value as well as a comparison with similar homes in the area
Home Values in the Area
Average Home Value in this Area
Purchase History
| Date | Buyer | Sale Price | Title Company |
|---|---|---|---|
| Rodrigues Victor | $320,000 | None Available | |
| Souza David G | $120,000 | -- |
Source: Public Records
Mortgage History
| Date | Status | Borrower | Loan Amount |
|---|---|---|---|
| Open | Rodrigues Victor | $80,000 | |
| Previous Owner | Souza David G | $165,000 | |
| Previous Owner | Souza David G | $140,000 | |
| Previous Owner | Souza David G | $108,000 |
Source: Public Records
Tax History
| Year | Tax Paid | Tax Assessment Tax Assessment Total Assessment is a certain percentage of the fair market value that is determined by local assessors to be the total taxable value of land and additions on the property. | Land | Improvement |
|---|---|---|---|---|
| 2025 | $6,347 | $554,300 | $145,300 | $409,000 |
| 2024 | $5,775 | $502,600 | $139,700 | $362,900 |
| 2023 | $5,393 | $439,500 | $125,400 | $314,100 |
| 2022 | $4,860 | $385,100 | $116,100 | $269,000 |
| 2021 | $5,329 | $385,300 | $109,600 | $275,700 |
| 2020 | $5,490 | $379,900 | $105,500 | $274,400 |
| 2019 | $5,539 | $379,900 | $105,500 | $274,400 |
| 2018 | $5,186 | $354,700 | $105,500 | $249,200 |
| 2017 | $4,845 | $346,100 | $105,500 | $240,600 |
| 2016 | $4,344 | $318,700 | $105,500 | $213,200 |
| 2015 | $4,154 | $317,600 | $98,700 | $218,900 |
| 2014 | $3,995 | $317,600 | $98,700 | $218,900 |
Source: Public Records
Map
Nearby Homes
- 168 Windsor St
- 243 Oak Grove Ave
- 150 Downing St
- 165 Eastern Ave
- 580 County St
- 677 Oak Grove Ave
- 36 Fordney St
- 295 Newbury St
- 756 County St
- 10 Carlisa Dr
- 352 Barnes St
- 70 Jencks St
- 742 New Boston Rd
- 84 Healy St
- 157 Earle St
- 219 Earle St Unit 3
- 217 Earle St Unit 2
- 215 Earle St Unit 1
- 88 Harrison St Unit 5
- 178 Thomas St
Your Personal Tour Guide
Ask me questions while you tour the home.