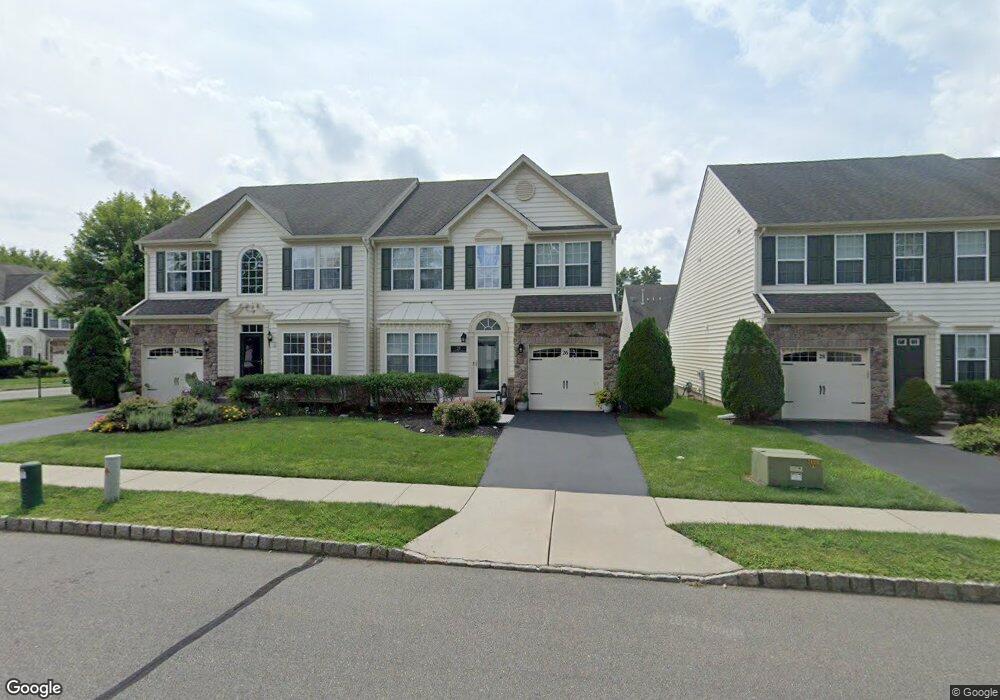
26 Thornton St Hillsborough, NJ 08844
Estimated Value: $545,000 - $584,000
3
Beds
4
Baths
1,888
Sq Ft
$299/Sq Ft
Est. Value
About This Home
This home is located at 26 Thornton St, Hillsborough, NJ 08844 and is currently estimated at $565,292, approximately $299 per square foot. 26 Thornton St is a home located in Somerset County with nearby schools including Hillsborough High School.
Ownership History
Date
Name
Owned For
Owner Type
Purchase Details
Closed on
Sep 14, 2020
Sold by
Librizzi Joseph
Bought by
Agostino Bruce and Agostino Linda
Current Estimated Value
Purchase Details
Closed on
Nov 30, 2015
Sold by
Librizzi Christina M
Bought by
Librizzi Joseph
Purchase Details
Closed on
Nov 17, 2008
Sold by
Nvr Inc
Bought by
Librizzi Christina M and Librizzi Joseph
Purchase Details
Closed on
Jul 23, 2008
Sold by
Atlantic Equity Westmeade Llc
Bought by
Nvr Inc
Create a Home Valuation Report for This Property
The Home Valuation Report is an in-depth analysis detailing your home's value as well as a comparison with similar homes in the area
Home Values in the Area
Average Home Value in this Area
Purchase History
| Date | Buyer | Sale Price | Title Company |
|---|---|---|---|
| Agostino Bruce | $390,000 | None Listed On Document | |
| Librizzi Joseph | -- | Attorney | |
| Librizzi Christina M | $336,135 | None Available | |
| Nvr Inc | $127,000 | Title America Agency Corp |
Source: Public Records
Tax History Compared to Growth
Tax History
| Year | Tax Paid | Tax Assessment Tax Assessment Total Assessment is a certain percentage of the fair market value that is determined by local assessors to be the total taxable value of land and additions on the property. | Land | Improvement |
|---|---|---|---|---|
| 2025 | $9,530 | $498,300 | $210,000 | $288,300 |
| 2024 | $9,530 | $444,700 | $195,000 | $249,700 |
| 2023 | $8,524 | $395,900 | $145,000 | $250,900 |
| 2022 | $8,537 | $382,300 | $130,000 | $252,300 |
| 2021 | $8,655 | $368,600 | $115,000 | $253,600 |
| 2020 | $8,821 | $370,000 | $115,000 | $255,000 |
| 2019 | $8,835 | $367,500 | $110,000 | $257,500 |
| 2018 | $8,788 | $363,300 | $100,000 | $263,300 |
| 2017 | $8,699 | $360,200 | $95,000 | $265,200 |
| 2016 | $8,406 | $348,200 | $95,000 | $253,200 |
| 2015 | $7,984 | $334,900 | $95,000 | $239,900 |
| 2014 | $7,207 | $308,800 | $74,300 | $234,500 |
Source: Public Records
Map
Nearby Homes