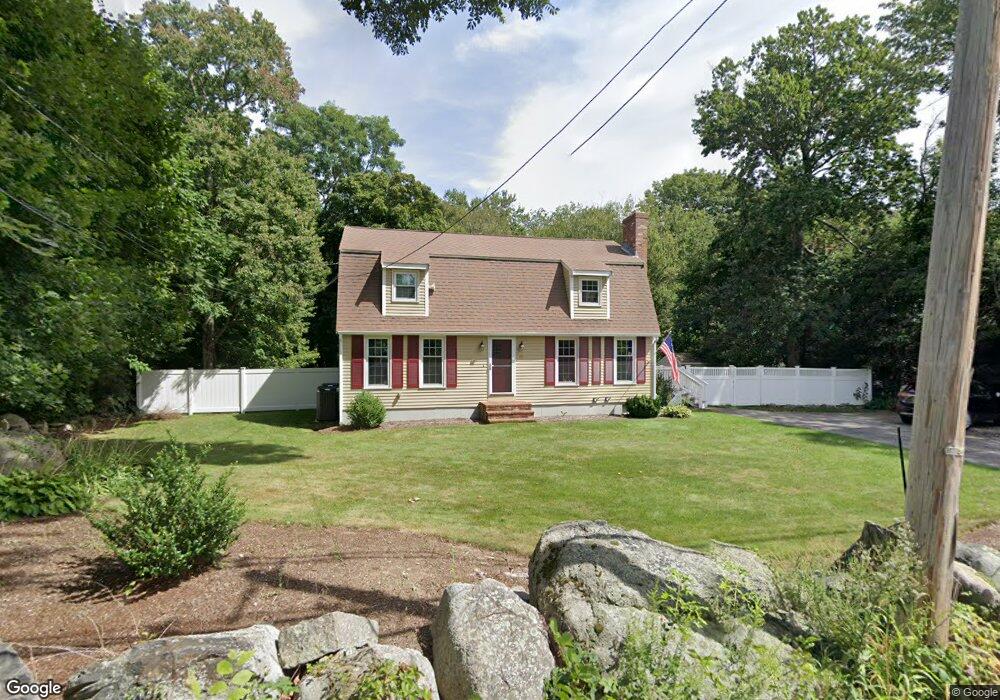
26 Tremont St Mansfield, MA 02048
Estimated Value: $644,000 - $712,000
3
Beds
2
Baths
1,598
Sq Ft
$423/Sq Ft
Est. Value
About This Home
This home is located at 26 Tremont St, Mansfield, MA 02048 and is currently estimated at $676,345, approximately $423 per square foot. 26 Tremont St is a home located in Bristol County with nearby schools including Everett W. Robinson Elementary School, Jordan/Jackson Elementary School, and Harold L. Qualters Middle School.
Ownership History
Date
Name
Owned For
Owner Type
Purchase Details
Closed on
Oct 22, 2003
Sold by
Sibilia Linda T and Sibilia Robert F
Bought by
Awley Douglas A and Awley Tracy E
Current Estimated Value
Purchase Details
Closed on
Feb 25, 1991
Sold by
Crowley Ronald and Crowley Brenda
Bought by
Awley Douglas and Awley Tracy
Create a Home Valuation Report for This Property
The Home Valuation Report is an in-depth analysis detailing your home's value as well as a comparison with similar homes in the area
Home Values in the Area
Average Home Value in this Area
Purchase History
| Date | Buyer | Sale Price | Title Company |
|---|---|---|---|
| Awley Douglas A | $4,526 | -- | |
| Awley Douglas | $168,900 | -- |
Source: Public Records
Mortgage History
| Date | Status | Borrower | Loan Amount |
|---|---|---|---|
| Previous Owner | Awley Douglas | $40,000 | |
| Previous Owner | Awley Douglas | $192,000 |
Source: Public Records
Tax History Compared to Growth
Tax History
| Year | Tax Paid | Tax Assessment Tax Assessment Total Assessment is a certain percentage of the fair market value that is determined by local assessors to be the total taxable value of land and additions on the property. | Land | Improvement |
|---|---|---|---|---|
| 2025 | $7,234 | $549,300 | $229,200 | $320,100 |
| 2024 | $6,947 | $514,600 | $229,200 | $285,400 |
| 2023 | $6,745 | $478,700 | $229,200 | $249,500 |
| 2022 | $6,484 | $427,400 | $212,200 | $215,200 |
| 2021 | $0 | $415,300 | $185,600 | $229,700 |
| 2020 | $4,226 | $400,400 | $176,800 | $223,600 |
| 2019 | $5,677 | $373,000 | $147,400 | $225,600 |
| 2018 | $5,676 | $362,000 | $140,500 | $221,500 |
| 2017 | $5,286 | $351,900 | $136,400 | $215,500 |
| 2016 | $5,073 | $329,200 | $130,000 | $199,200 |
| 2015 | $4,946 | $319,100 | $130,000 | $189,100 |
Source: Public Records
Map
Nearby Homes