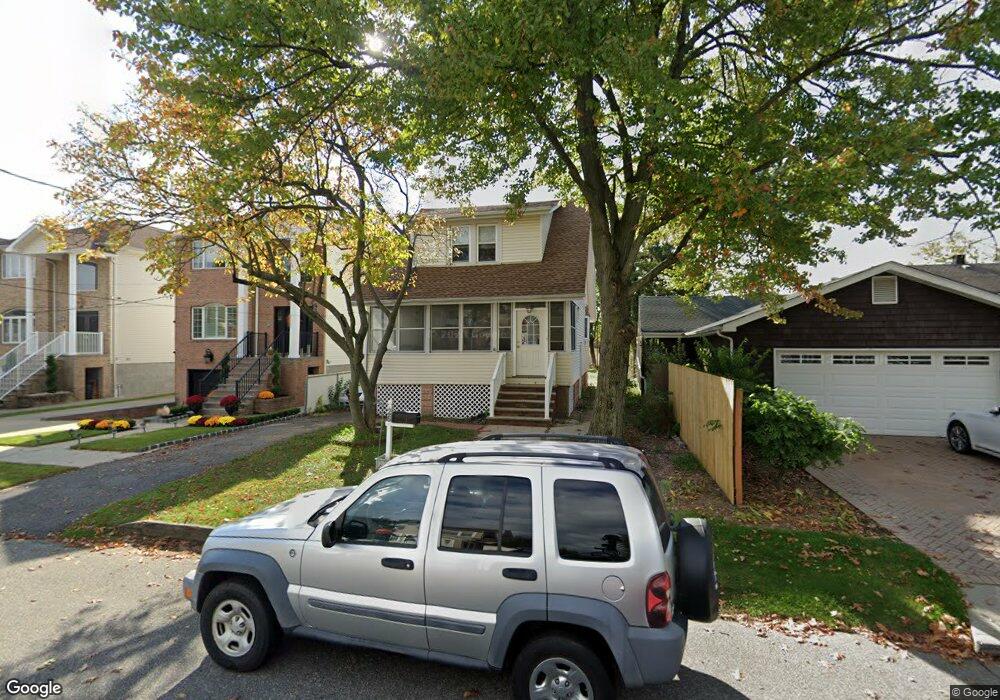
26 Truman St Staten Island, NY 10307
Tottenville NeighborhoodEstimated Value: $577,000 - $752,000
--
Bed
4
Baths
1,180
Sq Ft
$571/Sq Ft
Est. Value
About This Home
This home is located at 26 Truman St, Staten Island, NY 10307 and is currently estimated at $674,252, approximately $571 per square foot. 26 Truman St is a home located in Richmond County with nearby schools including P.S. 6 Cpl Allan F Kivlehan School, Is 34 Tottenville, and Tottenville High School.
Ownership History
Date
Name
Owned For
Owner Type
Purchase Details
Closed on
Jul 22, 2011
Sold by
Schacht Katherine M and Schacht Warren
Bought by
Schacht Katherine M
Current Estimated Value
Purchase Details
Closed on
Sep 16, 2004
Sold by
Schacht Katherine M
Bought by
Schacht Warren and Schacht Katherine M
Home Financials for this Owner
Home Financials are based on the most recent Mortgage that was taken out on this home.
Original Mortgage
$110,000
Interest Rate
5.78%
Mortgage Type
New Conventional
Create a Home Valuation Report for This Property
The Home Valuation Report is an in-depth analysis detailing your home's value as well as a comparison with similar homes in the area
Home Values in the Area
Average Home Value in this Area
Purchase History
| Date | Buyer | Sale Price | Title Company |
|---|---|---|---|
| Schacht Katherine M | $173,698 | Commonwealth Land Title Insu | |
| Schacht Warren | -- | -- |
Source: Public Records
Mortgage History
| Date | Status | Borrower | Loan Amount |
|---|---|---|---|
| Previous Owner | Schacht Warren | $110,000 |
Source: Public Records
Tax History Compared to Growth
Tax History
| Year | Tax Paid | Tax Assessment Tax Assessment Total Assessment is a certain percentage of the fair market value that is determined by local assessors to be the total taxable value of land and additions on the property. | Land | Improvement |
|---|---|---|---|---|
| 2025 | $4,850 | $46,200 | $9,185 | $37,015 |
| 2024 | $4,954 | $37,980 | $10,551 | $27,429 |
| 2023 | $5,001 | $27,868 | $9,238 | $18,630 |
| 2022 | $5,034 | $39,360 | $14,340 | $25,020 |
| 2021 | $5,035 | $34,440 | $14,340 | $20,100 |
| 2020 | $4,924 | $33,840 | $14,340 | $19,500 |
| 2019 | $4,579 | $32,100 | $14,340 | $17,760 |
| 2018 | $4,436 | $23,223 | $10,472 | $12,751 |
| 2017 | $4,228 | $22,213 | $11,248 | $10,965 |
| 2016 | $4,226 | $21,139 | $11,668 | $9,471 |
| 2015 | $3,419 | $20,551 | $9,007 | $11,544 |
| 2014 | $3,419 | $19,407 | $10,198 | $9,209 |
Source: Public Records
Map
Nearby Homes