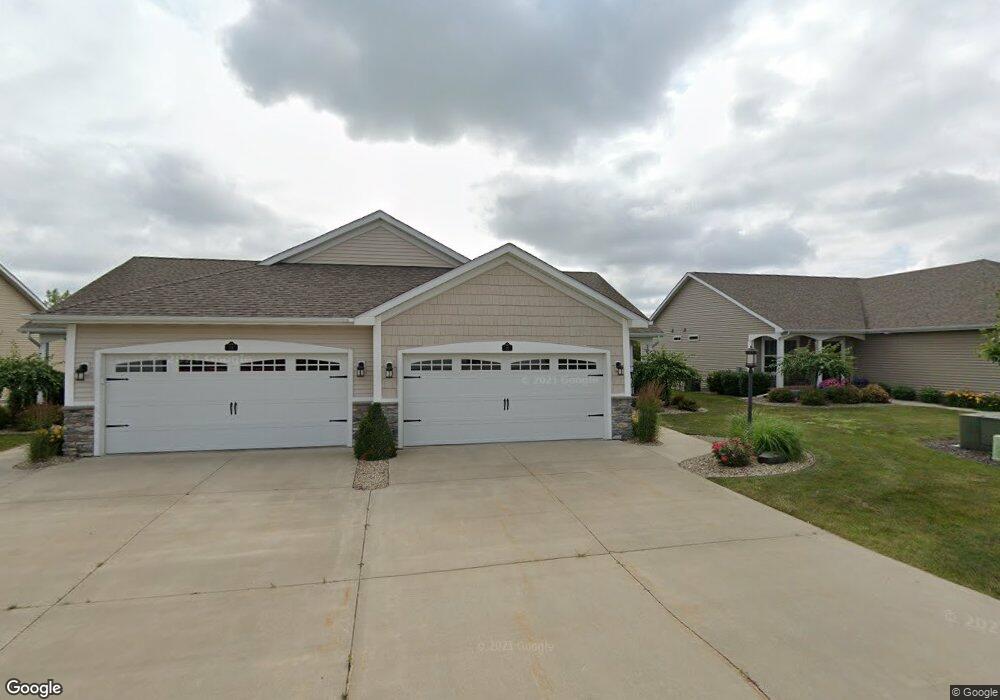
26 Tuscany Cir Unit 13 Saginaw, MI 48603
Estimated Value: $271,000 - $278,000
2
Beds
2
Baths
1,340
Sq Ft
$205/Sq Ft
Est. Value
About This Home
This home is located at 26 Tuscany Cir Unit 13, Saginaw, MI 48603 and is currently estimated at $274,739, approximately $205 per square foot. 26 Tuscany Cir Unit 13 is a home located in Saginaw County with nearby schools including Sherwood Elementary School, Weiss Elementary School, and White Pine Middle School.
Ownership History
Date
Name
Owned For
Owner Type
Purchase Details
Closed on
Jun 26, 2025
Sold by
Lichon Nancy A
Bought by
Hillert Edward and Hillert Darci Jo
Current Estimated Value
Home Financials for this Owner
Home Financials are based on the most recent Mortgage that was taken out on this home.
Original Mortgage
$87,000
Outstanding Balance
$86,853
Interest Rate
6.86%
Mortgage Type
New Conventional
Estimated Equity
$187,886
Purchase Details
Closed on
Dec 17, 2020
Sold by
Keifer Jeffrey S and Keifer Stephen Lee
Bought by
Lichon Nancy Ann
Purchase Details
Closed on
Dec 20, 2016
Sold by
Keifer Diane
Bought by
Keifer Revocable Living Trust and Stephen Lee Keifer
Purchase Details
Closed on
Apr 21, 2016
Sold by
Kenny Geraldine L
Bought by
Kenny Geraldine and Kenny Trust
Purchase Details
Closed on
Feb 22, 2012
Sold by
Monarch Development Company
Bought by
Keifer Diane
Home Financials for this Owner
Home Financials are based on the most recent Mortgage that was taken out on this home.
Original Mortgage
$54,000
Interest Rate
3.89%
Mortgage Type
Purchase Money Mortgage
Purchase Details
Closed on
Aug 10, 2006
Sold by
Rapanos David G
Bought by
Monarch Development Co.
Purchase Details
Closed on
Apr 26, 2006
Sold by
Hoefling Gerald and Hoefling Litsa
Bought by
Rapanos David G
Create a Home Valuation Report for This Property
The Home Valuation Report is an in-depth analysis detailing your home's value as well as a comparison with similar homes in the area
Home Values in the Area
Average Home Value in this Area
Purchase History
| Date | Buyer | Sale Price | Title Company |
|---|---|---|---|
| Hillert Edward | $267,000 | Capital Title Services | |
| Lichon Nancy Ann | $180,000 | None Available | |
| Keifer Revocable Living Trust | -- | -- | |
| Kenny Geraldine | -- | None Available | |
| Keifer Diane | $139,900 | -- | |
| Monarch Development Co. | -- | -- | |
| Rapanos David G | -- | -- |
Source: Public Records
Mortgage History
| Date | Status | Borrower | Loan Amount |
|---|---|---|---|
| Open | Hillert Edward | $87,000 | |
| Previous Owner | Keifer Diane | $54,000 |
Source: Public Records
Tax History Compared to Growth
Tax History
| Year | Tax Paid | Tax Assessment Tax Assessment Total Assessment is a certain percentage of the fair market value that is determined by local assessors to be the total taxable value of land and additions on the property. | Land | Improvement |
|---|---|---|---|---|
| 2025 | $4,240 | $123,200 | $0 | $0 |
| 2024 | $2,239 | $124,500 | $0 | $0 |
| 2023 | $2,131 | $117,800 | $0 | $0 |
| 2022 | $3,662 | $95,700 | $0 | $0 |
| 2021 | $3,336 | $91,300 | $0 | $0 |
| 2020 | $2,853 | $86,100 | $0 | $0 |
| 2019 | $2,732 | $88,100 | $0 | $0 |
| 2018 | $1,328 | $83,900 | $0 | $0 |
| 2017 | $2,363 | $83,000 | $0 | $0 |
| 2016 | $2,334 | $81,600 | $0 | $0 |
| 2014 | $2,280 | $79,000 | $0 | $79,000 |
| 2013 | -- | $72,200 | $0 | $0 |
Source: Public Records
Map
Nearby Homes
- 4270 Pebble Creek Ct
- 3347 Christy Way N
- 3425 Bramble Dr
- V/L Ballentrae
- 3820 Prairie Creek Ln
- 3776 Deibel Dr
- 0 Fashion Square Blvd
- 2705 Mccarty Rd
- 3595 Holly Ln
- 3716 Northwood Place
- 3391 Voight Place
- 4918 Coralberry Rd
- 4810 Mackinaw Rd
- 4171 Carmel Dr
- 4175 Scarlet Oak Dr
- 3741 Tittabawassee Rd
- VL Maplewoods Drive Dr W
- 37 Willow Pond Dr E
- 3730 Sherwood St
- 6050 Mackinaw Rd