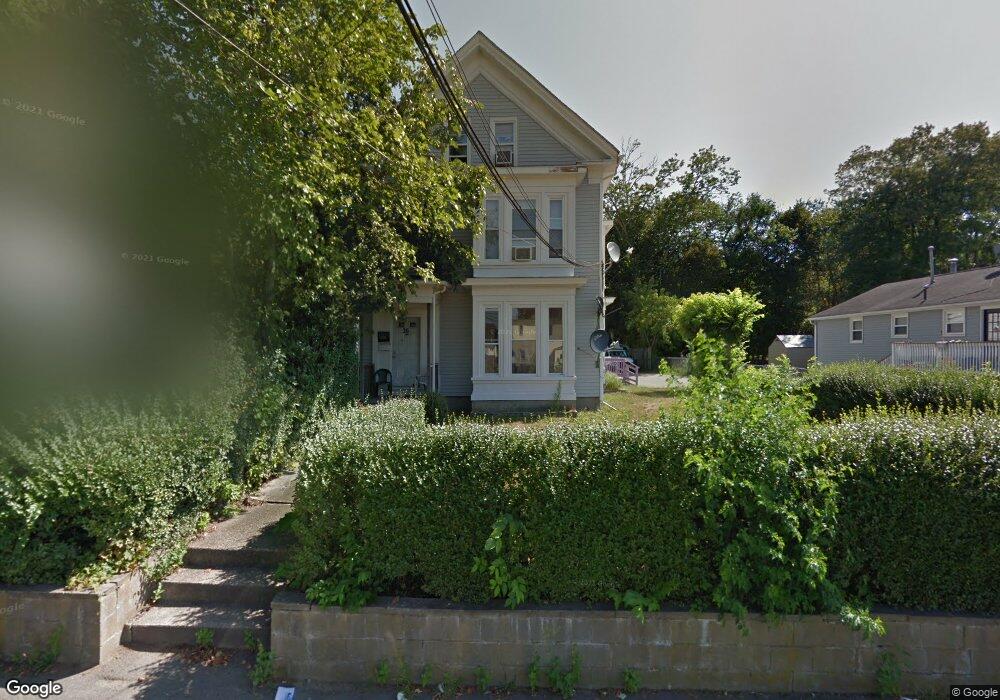
26 Tyler St Brockton, MA 02302
Estimated Value: $698,000 - $825,000
5
Beds
3
Baths
2,553
Sq Ft
$290/Sq Ft
Est. Value
About This Home
This home is located at 26 Tyler St, Brockton, MA 02302 and is currently estimated at $740,949, approximately $290 per square foot. 26 Tyler St is a home located in Plymouth County with nearby schools including Arnone Elementary School, Joseph F. Plouffe Middle School, and Brockton Area Seventh-Day Adventist Academy.
Ownership History
Date
Name
Owned For
Owner Type
Purchase Details
Closed on
Nov 7, 2002
Sold by
Johnson Mariana and Neves Eurides
Bought by
Okoawo Iyeoka I
Current Estimated Value
Home Financials for this Owner
Home Financials are based on the most recent Mortgage that was taken out on this home.
Original Mortgage
$292,500
Outstanding Balance
$122,695
Interest Rate
6.04%
Mortgage Type
Purchase Money Mortgage
Estimated Equity
$618,254
Purchase Details
Closed on
Mar 24, 1997
Sold by
Whalen Raymond J and Whalen Pauline F
Bought by
Johnson Mariana and Neves Eurides
Purchase Details
Closed on
Sep 22, 1993
Sold by
Shawmut Mtg Co
Bought by
Whalen Raymond J and Whalen Pauline F
Purchase Details
Closed on
Nov 30, 1992
Sold by
Huxley James L
Bought by
G E Capl Asset Mgt Crp
Create a Home Valuation Report for This Property
The Home Valuation Report is an in-depth analysis detailing your home's value as well as a comparison with similar homes in the area
Home Values in the Area
Average Home Value in this Area
Purchase History
| Date | Buyer | Sale Price | Title Company |
|---|---|---|---|
| Okoawo Iyeoka I | $292,500 | -- | |
| Johnson Mariana | $77,500 | -- | |
| Whalen Raymond J | $45,000 | -- | |
| G E Capl Asset Mgt Crp | $39,500 | -- |
Source: Public Records
Mortgage History
| Date | Status | Borrower | Loan Amount |
|---|---|---|---|
| Open | G E Capl Asset Mgt Crp | $67,000 | |
| Open | G E Capl Asset Mgt Crp | $292,500 | |
| Previous Owner | G E Capl Asset Mgt Crp | $98,160 |
Source: Public Records
Tax History Compared to Growth
Tax History
| Year | Tax Paid | Tax Assessment Tax Assessment Total Assessment is a certain percentage of the fair market value that is determined by local assessors to be the total taxable value of land and additions on the property. | Land | Improvement |
|---|---|---|---|---|
| 2025 | $7,965 | $657,700 | $142,400 | $515,300 |
| 2024 | $7,801 | $649,000 | $142,400 | $506,600 |
| 2023 | $7,083 | $545,700 | $115,600 | $430,100 |
| 2022 | $6,863 | $491,300 | $105,200 | $386,100 |
| 2021 | $6,715 | $463,100 | $89,900 | $373,200 |
| 2020 | $6,018 | $397,200 | $81,800 | $315,400 |
| 2019 | $5,588 | $359,600 | $79,000 | $280,600 |
| 2018 | $5,308 | $330,500 | $79,000 | $251,500 |
| 2017 | $5,123 | $318,200 | $79,000 | $239,200 |
| 2016 | $4,654 | $268,100 | $77,400 | $190,700 |
| 2015 | $3,630 | $200,000 | $77,400 | $122,600 |
| 2014 | $3,619 | $199,600 | $77,400 | $122,200 |
Source: Public Records
Map
Nearby Homes