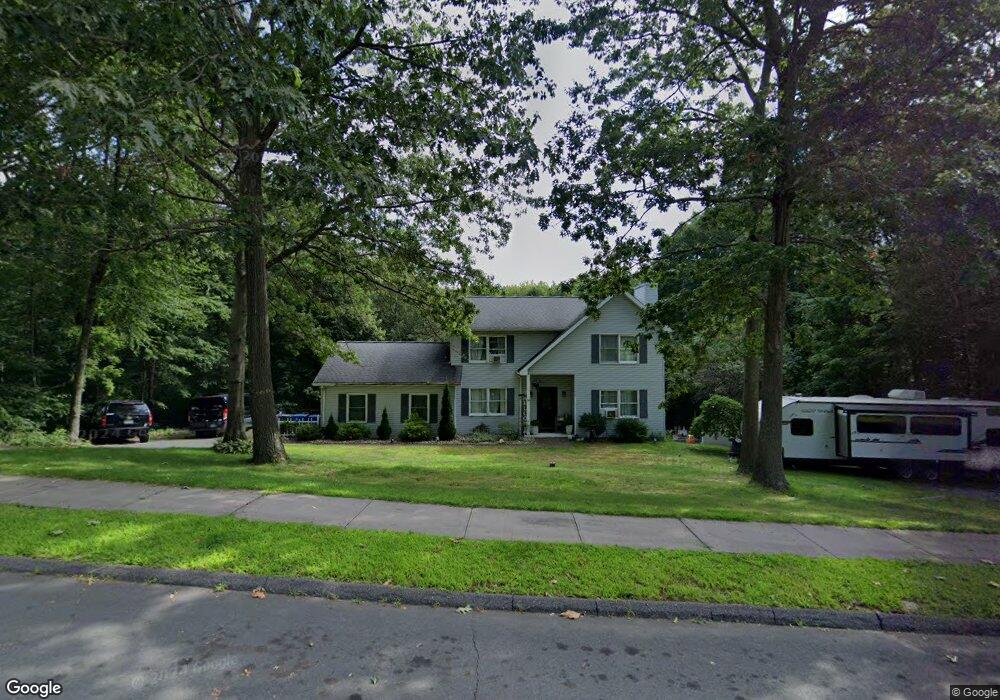
26 Tyler Way Bristol, CT 06010
South Bristol NeighborhoodEstimated Value: $458,000 - $553,000
3
Beds
2
Baths
2,228
Sq Ft
$222/Sq Ft
Est. Value
About This Home
This home is located at 26 Tyler Way, Bristol, CT 06010 and is currently estimated at $495,329, approximately $222 per square foot. 26 Tyler Way is a home located in Hartford County with nearby schools including Chippens Hill Middle School, Bristol Central High School, and Immanuel Lutheran School.
Ownership History
Date
Name
Owned For
Owner Type
Purchase Details
Closed on
Aug 19, 2022
Sold by
Baden Robert B
Bought by
Baden Robert B and Hale Debra L
Current Estimated Value
Purchase Details
Closed on
Nov 18, 1998
Sold by
Mccartney Michael J and Mccarney Nadia J
Bought by
Hale Michall R
Home Financials for this Owner
Home Financials are based on the most recent Mortgage that was taken out on this home.
Original Mortgage
$123,500
Interest Rate
6.49%
Purchase Details
Closed on
Jun 30, 1994
Sold by
Rockwood Dev Inc
Bought by
Mccartney Michael J and Mccartney Nadia J
Home Financials for this Owner
Home Financials are based on the most recent Mortgage that was taken out on this home.
Original Mortgage
$144,000
Interest Rate
6.25%
Mortgage Type
Unknown
Create a Home Valuation Report for This Property
The Home Valuation Report is an in-depth analysis detailing your home's value as well as a comparison with similar homes in the area
Home Values in the Area
Average Home Value in this Area
Purchase History
| Date | Buyer | Sale Price | Title Company |
|---|---|---|---|
| Baden Robert B | -- | None Available | |
| Hale Michall R | $145,400 | -- | |
| Mccartney Michael J | $160,000 | -- |
Source: Public Records
Mortgage History
| Date | Status | Borrower | Loan Amount |
|---|---|---|---|
| Previous Owner | Mccartney Michael J | $17,500 | |
| Previous Owner | Mccartney Michael J | $123,500 | |
| Previous Owner | Mccartney Michael J | $144,000 |
Source: Public Records
Tax History
| Year | Tax Paid | Tax Assessment Tax Assessment Total Assessment is a certain percentage of the fair market value that is determined by local assessors to be the total taxable value of land and additions on the property. | Land | Improvement |
|---|---|---|---|---|
| 2025 | $7,624 | $225,890 | $55,370 | $170,520 |
| 2024 | $7,195 | $225,890 | $55,370 | $170,520 |
| 2023 | $6,856 | $225,890 | $55,370 | $170,520 |
| 2022 | $6,268 | $163,450 | $42,770 | $120,680 |
| 2021 | $6,268 | $163,450 | $42,770 | $120,680 |
| 2020 | $6,268 | $163,450 | $42,770 | $120,680 |
| 2019 | $6,219 | $163,450 | $42,770 | $120,680 |
| 2018 | $6,028 | $163,450 | $42,770 | $120,680 |
| 2017 | $5,897 | $163,660 | $61,040 | $102,620 |
| 2016 | $5,897 | $163,660 | $61,040 | $102,620 |
| 2015 | $5,664 | $163,660 | $61,040 | $102,620 |
| 2014 | $5,664 | $163,660 | $61,040 | $102,620 |
Source: Public Records
Map
Nearby Homes
- 120 Tyler Way
- 140 Corbin Ridge
- 145 Corbin Ridge
- 13 Overlook Terrace
- 22 Overlook Terrace
- 2 Overlook Rd
- 42 Eastview Rd
- 68 Doris Rd
- 272 Old Orchard Rd
- 27 Club Ln
- 20 Brookview Cir
- 30 Brookview Cir Unit 30
- 115 Kilmartin Ave
- 26 Kilmartin Ave
- 11 Cedar Ave
- 573 Wolcott Rd
- 66 Mattatuck Rd
- 23 North St
- 22 North St
- 44 Old Waterbury Rd
Your Personal Tour Guide
Ask me questions while you tour the home.